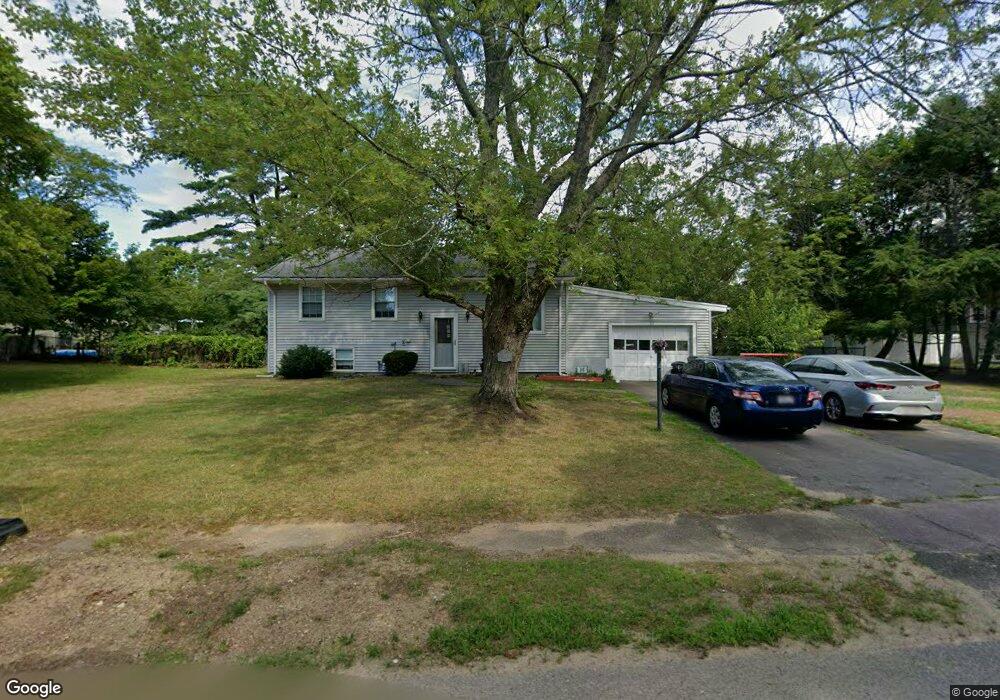
32 Frisbie Rd Marshfield, MA 02050
Estimated Value: $618,000 - $722,000
3
Beds
1
Bath
1,250
Sq Ft
$539/Sq Ft
Est. Value
About This Home
This home is located at 32 Frisbie Rd, Marshfield, MA 02050 and is currently estimated at $673,161, approximately $538 per square foot. 32 Frisbie Rd is a home located in Plymouth County with nearby schools including Daniel Webster, Furnace Brook Middle School, and Marshfield High School.
Ownership History
Date
Name
Owned For
Owner Type
Purchase Details
Closed on
Oct 29, 2004
Sold by
Chandler Scott E and Chandler Kathryn R
Bought by
Smith Keith M and Smith Jennifer
Current Estimated Value
Home Financials for this Owner
Home Financials are based on the most recent Mortgage that was taken out on this home.
Original Mortgage
$296,000
Interest Rate
5.74%
Mortgage Type
Purchase Money Mortgage
Purchase Details
Closed on
Oct 15, 2002
Sold by
Doherty Joanne J
Bought by
Chandler Scott E and Chandler Kathryn R
Create a Home Valuation Report for This Property
The Home Valuation Report is an in-depth analysis detailing your home's value as well as a comparison with similar homes in the area
Home Values in the Area
Average Home Value in this Area
Purchase History
We collect this data history from publicly available records. To have your information removed, we recommend requesting removal directly through your county’s website.
| Date | Buyer | Sale Price | Title Company |
|---|---|---|---|
| Smith Keith M | $370,000 | -- | |
| Chandler Scott E | $240,000 | -- |
Source: Public Records
Mortgage History
We collect this data history from publicly available records. To have your information removed, we recommend requesting removal directly through your county’s website.
| Date | Status | Borrower | Loan Amount |
|---|---|---|---|
| Open | Chandler Scott E | $335,965 | |
| Closed | Chandler Scott E | $335,137 | |
| Closed | Chandler Scott E | $296,000 |
Source: Public Records
Tax History
| Year | Tax Paid | Tax Assessment Tax Assessment Total Assessment is a certain percentage of the fair market value that is determined by local assessors to be the total taxable value of land and additions on the property. | Land | Improvement |
|---|---|---|---|---|
| 2025 | $5,637 | $569,400 | $305,400 | $264,000 |
| 2024 | $5,516 | $530,900 | $290,800 | $240,100 |
| 2023 | $5,028 | $467,500 | $259,700 | $207,800 |
| 2022 | $5,028 | $388,300 | $218,100 | $170,200 |
| 2021 | $4,969 | $376,700 | $218,100 | $158,600 |
| 2020 | $4,707 | $353,100 | $197,400 | $155,700 |
| 2019 | $4,628 | $345,900 | $197,400 | $148,500 |
| 2018 | $4,527 | $338,600 | $197,400 | $141,200 |
| 2017 | $4,370 | $318,500 | $197,400 | $121,100 |
| 2016 | $4,340 | $312,700 | $197,400 | $115,300 |
| 2015 | $4,156 | $312,700 | $197,400 | $115,300 |
| 2014 | $3,944 | $296,800 | $197,400 | $99,400 |
Source: Public Records
Map
Nearby Homes
- 134 Wellington Ave
- 18 Somerville St
- 19 Copeland St
- 155 Quincy Ave
- 21 Washington Ave
- 1221 Ocean St
- 757 S River St
- 91 Winslow St
- 8 Duxbury St
- 54 Longview Terrace
- 713 Webster St
- 14 Ivy St
- 1028 Ocean St
- 46 Fairways Edge Dr
- 555 Webster St
- 599 Moraine St
- 24 Proctor St
- 274 Foster Ave
- 264 Webster St
- 412 Moraine St
Your Personal Tour Guide
Ask me questions while you tour the home.