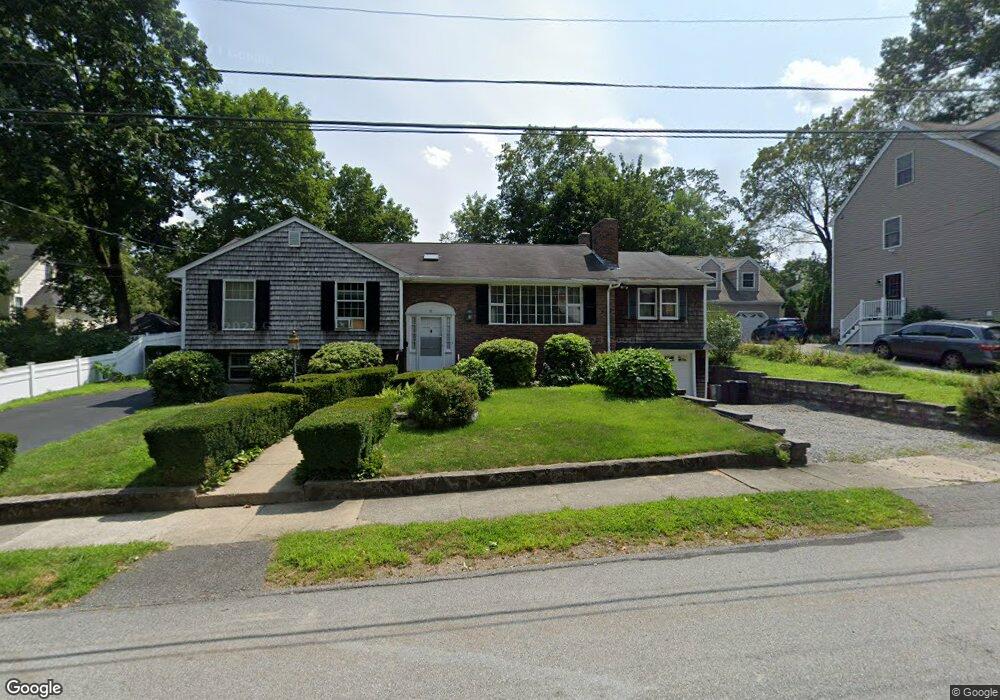
32 Howard St Reading, MA 01867
Estimated Value: $1,122,000 - $1,387,000
4
Beds
3
Baths
3,167
Sq Ft
$384/Sq Ft
Est. Value
About This Home
This home is located at 32 Howard St, Reading, MA 01867 and is currently estimated at $1,214,861, approximately $383 per square foot. 32 Howard St is a home located in Middlesex County with nearby schools including Joshua Eaton Elementary School, Walter S. Parker Middle School, and Reading Memorial High School.
Ownership History
Date
Name
Owned For
Owner Type
Purchase Details
Closed on
Jan 15, 2008
Sold by
Romano Rt
Bought by
32 Howard Street Rt
Current Estimated Value
Purchase Details
Closed on
Apr 8, 2004
Sold by
Romano John A and Romano Louise A
Bought by
Romano John A and Romano Louise A
Purchase Details
Closed on
Sep 1, 1983
Bought by
32 Howard St Rt
Create a Home Valuation Report for This Property
The Home Valuation Report is an in-depth analysis detailing your home's value as well as a comparison with similar homes in the area
Home Values in the Area
Average Home Value in this Area
Purchase History
| Date | Buyer | Sale Price | Title Company |
|---|---|---|---|
| 32 Howard Street Rt | -- | -- | |
| Romano John A | -- | -- | |
| 32 Howard St Rt | $125,800 | -- |
Source: Public Records
Mortgage History
| Date | Status | Borrower | Loan Amount |
|---|---|---|---|
| Previous Owner | 32 Howard St Rt | $100,000 |
Source: Public Records
Tax History
| Year | Tax Paid | Tax Assessment Tax Assessment Total Assessment is a certain percentage of the fair market value that is determined by local assessors to be the total taxable value of land and additions on the property. | Land | Improvement |
|---|---|---|---|---|
| 2025 | $11,191 | $982,500 | $559,500 | $423,000 |
| 2024 | $11,327 | $966,500 | $550,400 | $416,100 |
| 2023 | $10,661 | $846,800 | $482,200 | $364,600 |
| 2022 | $10,648 | $798,800 | $454,900 | $343,900 |
| 2021 | $5,527 | $763,800 | $416,200 | $347,600 |
| 2020 | $10,132 | $726,300 | $395,800 | $330,500 |
| 2019 | $9,712 | $682,500 | $371,900 | $310,600 |
| 2018 | $4,582 | $638,700 | $348,000 | $290,700 |
| 2017 | $4,455 | $626,200 | $341,200 | $285,000 |
| 2016 | $8,568 | $590,900 | $336,800 | $254,100 |
| 2015 | $7,897 | $537,200 | $306,200 | $231,000 |
| 2014 | $7,918 | $537,200 | $306,200 | $231,000 |
Source: Public Records
Map
Nearby Homes
- 103 Oak St
- 100 Prescott St
- 212 West St Unit 1
- 37 Fremont St
- 29 Louanis Dr
- 101 King St Unit 101
- 5 Washington St Unit D4
- 319 West St
- 51 Winslow Rd
- 20 Pinevale Ave
- 75 Whitehall Ln
- 24 Minot St
- 26 Lothrop Rd
- 45 Longview Rd
- 133 Pine Ridge Rd
- 16 Munroe Ave
- 33 Old Farm Rd
- 1 Garvey Rd Unit 1
- 69 Ash St
- 349 South St
Your Personal Tour Guide
Ask me questions while you tour the home.