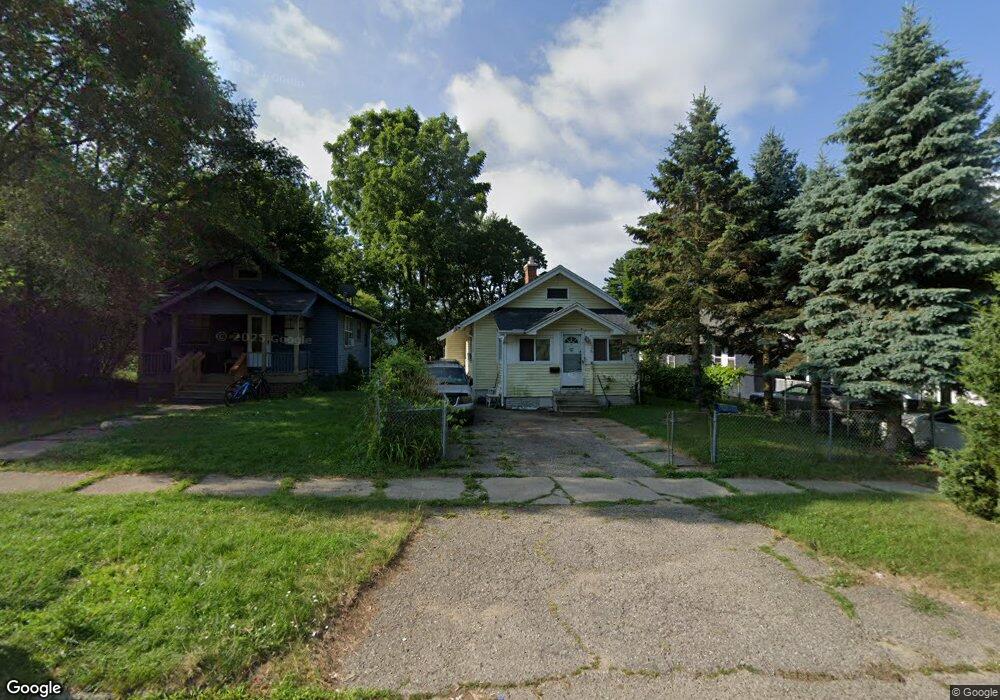
32 Kemp St Pontiac, MI 48342
Estimated Value: $100,355 - $123,000
2
Beds
1
Bath
787
Sq Ft
$142/Sq Ft
Est. Value
About This Home
This home is located at 32 Kemp St, Pontiac, MI 48342 and is currently estimated at $111,678, approximately $141 per square foot. 32 Kemp St is a home located in Oakland County with nearby schools including Owen Elementary School, Pontiac Middle School, and Pontiac High School.
Ownership History
Date
Name
Owned For
Owner Type
Purchase Details
Closed on
Aug 6, 2018
Sold by
County Of Oakland
Bought by
Property Prospects Llc
Current Estimated Value
Purchase Details
Closed on
Nov 2, 2015
Sold by
Kemp 32 Llc
Bought by
Midas Development Corp
Purchase Details
Closed on
Nov 21, 2012
Sold by
Ivezaj Franz John and Ivezaj Lindita
Bought by
Kemp 32 Llc
Purchase Details
Closed on
Oct 25, 2010
Sold by
Meisner Andrew E
Bought by
Ivezaj Franz
Purchase Details
Closed on
Nov 12, 2001
Sold by
Hart James T
Bought by
Boche Juan
Create a Home Valuation Report for This Property
The Home Valuation Report is an in-depth analysis detailing your home's value as well as a comparison with similar homes in the area
Home Values in the Area
Average Home Value in this Area
Purchase History
| Date | Buyer | Sale Price | Title Company |
|---|---|---|---|
| Property Prospects Llc | $12,000 | None Available | |
| Midas Development Corp | $10,000 | None Available | |
| Kemp 32 Llc | $32,500 | None Available | |
| Ivezaj Franz | $600 | None Available | |
| Boche Juan | $38,000 | -- |
Source: Public Records
Tax History
| Year | Tax Paid | Tax Assessment Tax Assessment Total Assessment is a certain percentage of the fair market value that is determined by local assessors to be the total taxable value of land and additions on the property. | Land | Improvement |
|---|---|---|---|---|
| 2025 | $988 | $26,680 | $0 | $0 |
| 2024 | $887 | $25,120 | $0 | $0 |
| 2023 | $845 | $22,390 | $0 | $0 |
| 2022 | $878 | $19,900 | $0 | $0 |
| 2021 | $854 | $17,670 | $0 | $0 |
| 2020 | $769 | $15,890 | $0 | $0 |
| 2019 | $821 | $13,740 | $0 | $0 |
| 2018 | $690 | $12,530 | $0 | $0 |
| 2017 | $664 | $12,210 | $0 | $0 |
| 2016 | $890 | $11,400 | $0 | $0 |
| 2015 | -- | $11,150 | $0 | $0 |
| 2014 | -- | $10,520 | $0 | $0 |
| 2011 | -- | $14,640 | $0 | $0 |
Source: Public Records
Map
Nearby Homes
Your Personal Tour Guide
Ask me questions while you tour the home.