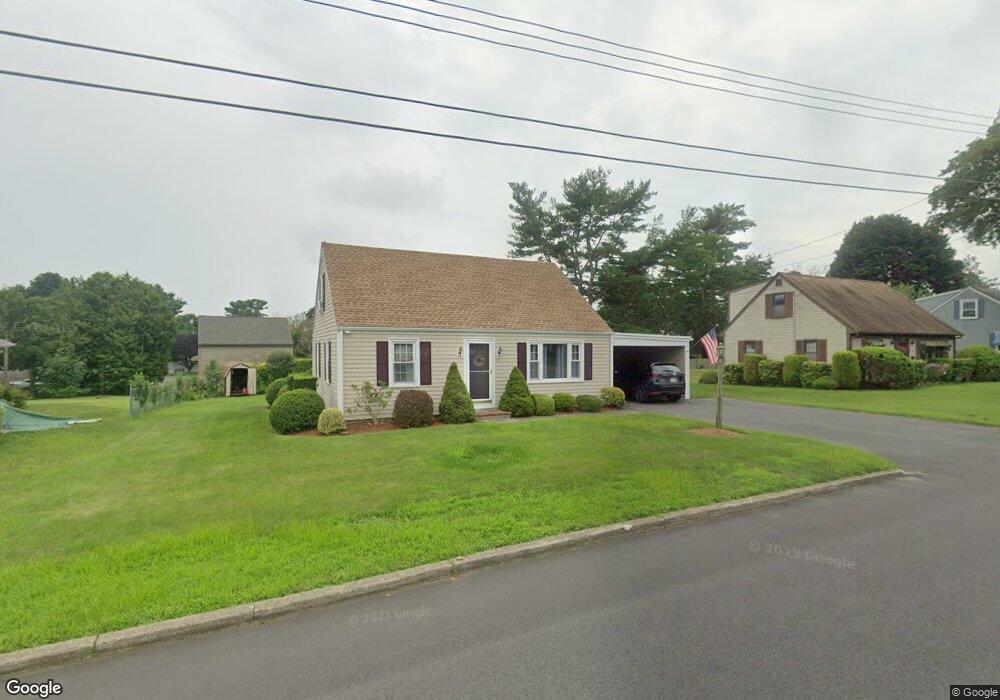
32 Ludlow St Acushnet, MA 02743
Coury Heights NeighborhoodEstimated Value: $458,740 - $537,000
3
Beds
1
Bath
1,389
Sq Ft
$370/Sq Ft
Est. Value
About This Home
This home is located at 32 Ludlow St, Acushnet, MA 02743 and is currently estimated at $513,435, approximately $369 per square foot. 32 Ludlow St is a home located in Bristol County with nearby schools including Acushnet Elementary School, Albert F Ford Middle School, and All Saints Catholic School.
Ownership History
Date
Name
Owned For
Owner Type
Purchase Details
Closed on
Sep 2, 2010
Sold by
Baptista Humberto M
Bought by
Baptista Humberto M and Baptista Susan
Current Estimated Value
Purchase Details
Closed on
Jan 31, 1994
Sold by
Tavares Anthony and Tavares Kathleen
Bought by
Baptista Humberto M
Create a Home Valuation Report for This Property
The Home Valuation Report is an in-depth analysis detailing your home's value as well as a comparison with similar homes in the area
Home Values in the Area
Average Home Value in this Area
Purchase History
We collect this data history from publicly available records. To have your information removed, we recommend requesting removal directly through your county’s website.
| Date | Buyer | Sale Price | Title Company |
|---|---|---|---|
| Baptista Humberto M | -- | -- | |
| Baptista Humberto M | $120,000 | -- |
Source: Public Records
Tax History
| Year | Tax Paid | Tax Assessment Tax Assessment Total Assessment is a certain percentage of the fair market value that is determined by local assessors to be the total taxable value of land and additions on the property. | Land | Improvement |
|---|---|---|---|---|
| 2025 | $41 | $379,000 | $121,500 | $257,500 |
| 2024 | $3,908 | $342,500 | $115,100 | $227,400 |
| 2023 | $3,944 | $328,700 | $104,400 | $224,300 |
| 2022 | $3,889 | $293,100 | $98,000 | $195,100 |
| 2021 | $3,416 | $247,000 | $98,000 | $149,000 |
| 2020 | $3,354 | $240,600 | $91,600 | $149,000 |
| 2019 | $3,182 | $224,400 | $87,400 | $137,000 |
| 2018 | $3,083 | $213,800 | $87,400 | $126,400 |
| 2017 | $2,982 | $206,500 | $87,400 | $119,100 |
| 2016 | $3,002 | $206,600 | $87,400 | $119,200 |
| 2015 | $2,759 | $193,200 | $87,400 | $105,800 |
Source: Public Records
Map
Nearby Homes
- 14 Ludlow St
- 97 Middle Rd
- 2453 Acushnet Ave
- 6 Middlefield Place
- 62 Maryland St
- 972 Maplewood St
- 34 Plympton St
- 264 Appleton St
- 259 Jarry St
- 15 Mary Dr
- 204 Lowell St
- 15 Hiram St
- 0 Church Dutton & Chaffee Unit 73371719
- 11 Boylston St
- 15 Jean St
- 466 Oliver St
- 1044 Victoria St Unit B-29
- 117 Farland Cir
- 23 Oliveira Ave
- 1096 Joyce St
Your Personal Tour Guide
Ask me questions while you tour the home.