32 Moncrief Rd Rockland, MA 02370
Estimated Value: $597,000 - $688,000
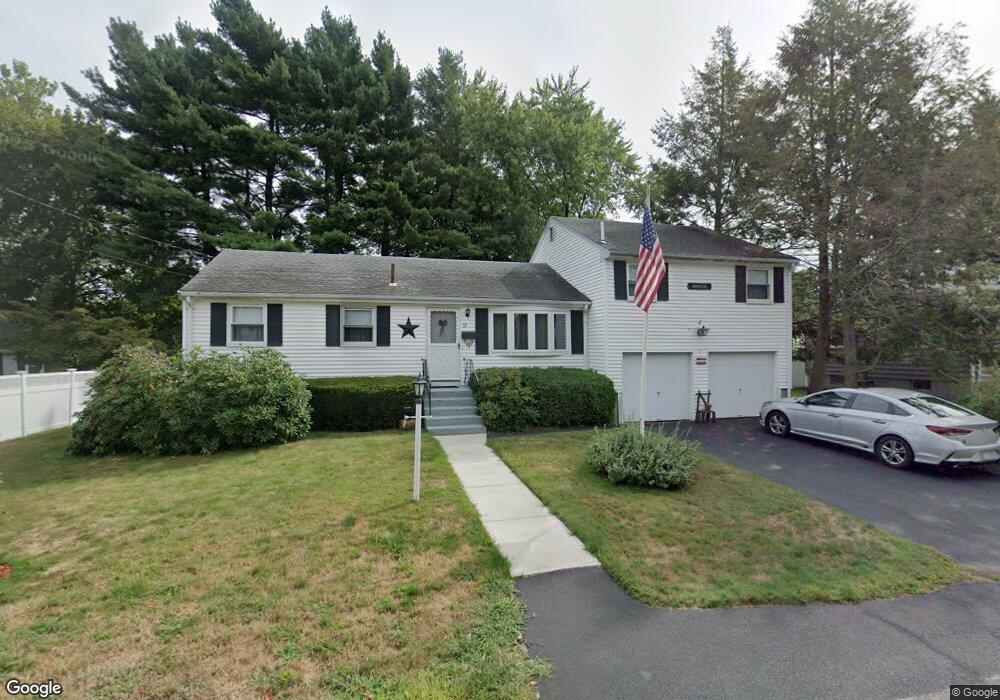
About This Home
This home is located at 32 Moncrief Rd, Rockland, MA 02370 and is currently estimated at $631,042, approximately $298 per square foot. 32 Moncrief Rd is a home located in Plymouth County with nearby schools including Rockland Senior High School, Calvary Chapel Academy, and Holy Family Elementary School.
Ownership History
We collect this data history from publicly available records. To have your information removed, we recommend requesting removal directly through your county’s website.
Purchase Details
Home Values in the Area
Average Home Value in this Area
Purchase History
We collect this data history from publicly available records. To have your information removed, we recommend requesting removal directly through your county’s website.
| Date | Buyer | Sale Price | Title Company |
|---|---|---|---|
| $152,900 | -- |
Mortgage History
We collect this data history from publicly available records. To have your information removed, we recommend requesting removal directly through your county’s website.
| Date | Status | Borrower | Loan Amount |
|---|---|---|---|
| Closed | $284,500 | ||
| Closed | $300,000 | ||
| Closed | $75,000 | ||
| Closed | $50,000 | ||
| Closed | $275,000 | ||
| Closed | $100,000 | ||
| Closed | $50,000 | ||
| Closed | $19,600 | ||
| Closed | $122,400 |
Tax History
We collect this data history from publicly available records. To have your information removed, we recommend requesting removal directly through your county’s website.
| Year | Tax Paid | Tax Assessment Tax Assessment Total Assessment is a certain percentage of the fair market value that is determined by local assessors to be the total taxable value of land and additions on the property. | Land | Improvement |
|---|---|---|---|---|
| 2025 | $7,322 | $535,600 | $224,400 | $311,200 |
| 2024 | $7,109 | $505,600 | $211,700 | $293,900 |
| 2023 | $7,064 | $464,100 | $194,200 | $269,900 |
| 2022 | $6,821 | $407,200 | $168,800 | $238,400 |
| 2021 | $66,912 | $360,800 | $153,500 | $207,300 |
| 2020 | $8,701 | $346,400 | $146,200 | $200,200 |
| 2019 | $2,702 | $332,700 | $139,300 | $193,400 |
| 2018 | $5,708 | $313,300 | $139,300 | $174,000 |
| 2017 | $68,381 | $297,800 | $139,300 | $158,500 |
| 2016 | $5,331 | $288,300 | $133,900 | $154,400 |
| 2015 | $5,091 | $267,500 | $125,200 | $142,300 |
| 2014 | $4,792 | $261,300 | $122,700 | $138,600 |
Map
- 115 Moncrief Rd
- 174 Damon Rd
- 72 Josh Gray Rd
- 20 Pine Hill Terrace
- 338 Levin Rd
- 83 Union St
- 48 Union St
- 313 E Water St
- 142 Marks St
- 27 Stanton St
- 62-64 W Water St
- 92-94 Stanton St
- 12 Linden St
- 28 Blanchard St
- 375 Webster St
- 20 Jackson Rd
- 75 Willow Pond Dr
- 491 Webster St
- 6 Lydon Ln Unit C1
- 119 Grove St Unit 234
Ask me questions while you tour the home.