32 Monroe St Keyport, NJ 07735
Estimated Value: $440,000 - $512,945
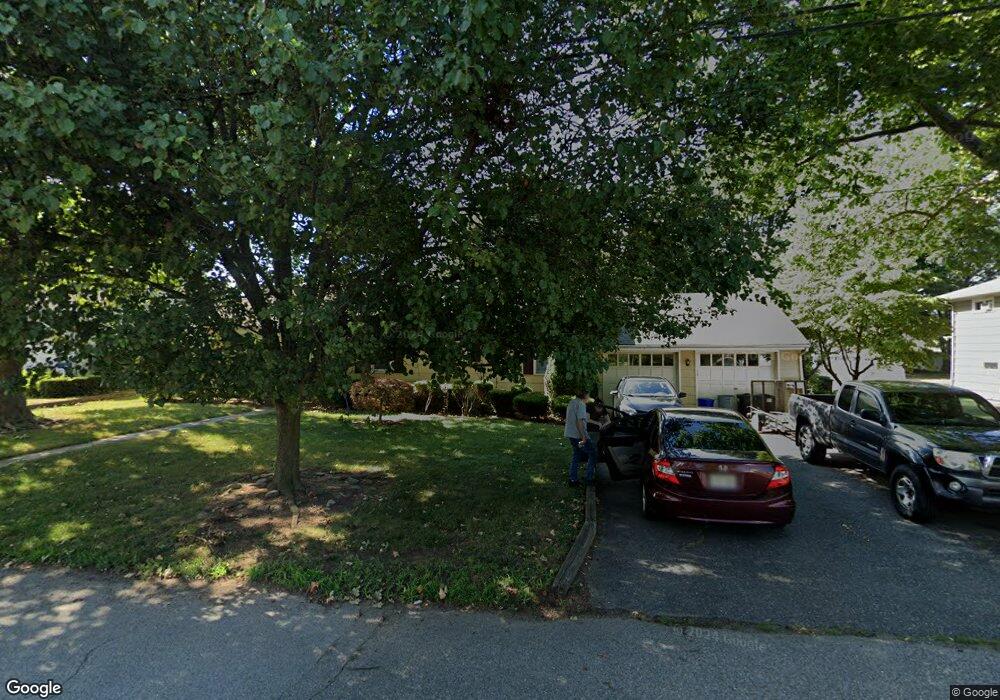
About This Home
This home is located at 32 Monroe St, Keyport, NJ 07735 and is currently estimated at $479,486, approximately $445 per square foot. 32 Monroe St is a home located in Monmouth County with nearby schools including Keyport Central School, Keyport High School, and Icob Academy.
Ownership History
We collect this data history from publicly available records. To have your information removed, we recommend requesting removal directly through your county’s website.
Purchase Details
Home Financials for this Owner
Home Financials are based on the most recent Mortgage that was taken out on this home.Home Values in the Area
Average Home Value in this Area
Purchase History
We collect this data history from publicly available records. To have your information removed, we recommend requesting removal directly through your county’s website.
| Date | Buyer | Sale Price | Title Company |
|---|---|---|---|
| $140,000 | -- |
Mortgage History
We collect this data history from publicly available records. To have your information removed, we recommend requesting removal directly through your county’s website.
| Date | Status | Borrower | Loan Amount |
|---|---|---|---|
| Open | $110,000 |
Tax History
We collect this data history from publicly available records. To have your information removed, we recommend requesting removal directly through your county’s website.
| Year | Tax Paid | Tax Assessment Tax Assessment Total Assessment is a certain percentage of the fair market value that is determined by local assessors to be the total taxable value of land and additions on the property. | Land | Improvement |
|---|---|---|---|---|
| 2025 | $7,810 | $418,600 | $255,200 | $163,400 |
| 2024 | $8,078 | $377,300 | $221,900 | $155,400 |
| 2023 | $8,078 | $367,500 | $201,800 | $165,700 |
| 2022 | $7,110 | $319,500 | $175,400 | $144,100 |
| 2021 | $7,110 | $281,700 | $162,500 | $119,200 |
| 2020 | $6,881 | $270,600 | $157,200 | $113,400 |
| 2019 | $7,140 | $281,200 | $152,200 | $129,000 |
| 2018 | $7,225 | $277,900 | $157,200 | $120,700 |
| 2017 | $7,075 | $271,400 | $152,200 | $119,200 |
| 2016 | $6,822 | $263,900 | $152,200 | $111,700 |
| 2015 | $6,425 | $247,400 | $137,200 | $110,200 |
| 2014 | $5,754 | $223,700 | $112,200 | $111,500 |
Map
- 39 Monroe St
- 4 231 Atlantic St Unit 39
- 231 Atlantic St Unit 59
- 231 Atlantic St Unit 39
- 38 Van Dorn St
- 9 Hurley St
- 12 Raritan Ave
- 437 Atlantic St
- 212 Atlantic St
- 14 Van Dorn St
- 2108 Florence Ave
- 250 Broad St
- 17 Coach Dr
- 51 Green Grove Ave
- 226 Osborn St
- 12 Ann Ct
- 101 Perry St
- 30 Pine Creek Village
- 20 Surrey Dr
- 48 Pine Creek Village
Ask me questions while you tour the home.