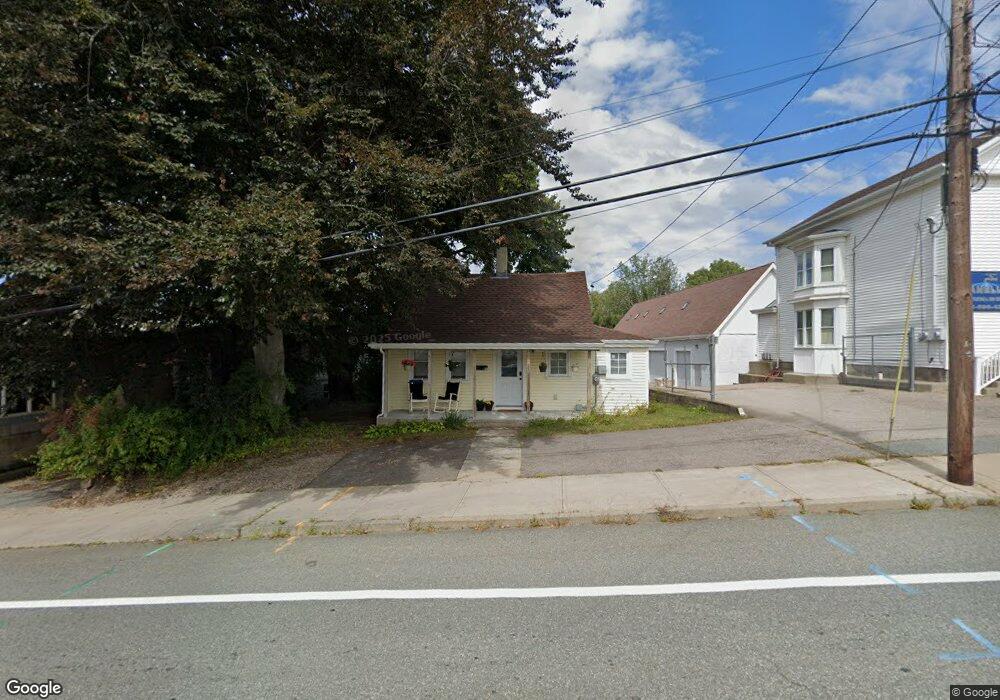
32 Oak St Westerly, RI 02891
Estimated Value: $365,000 - $471,923
6
Beds
3
Baths
2,717
Sq Ft
$154/Sq Ft
Est. Value
About This Home
This home is located at 32 Oak St, Westerly, RI 02891 and is currently estimated at $418,731, approximately $154 per square foot. 32 Oak St is a home located in Washington County with nearby schools including Westerly High School and St. Michael School.
Ownership History
Date
Name
Owned For
Owner Type
Purchase Details
Closed on
Aug 29, 2022
Sold by
Marrone Ronald M and Marrone Laura J
Bought by
Westwood Reality Partners
Current Estimated Value
Purchase Details
Closed on
Dec 8, 2006
Sold by
Paterno Cecile M
Bought by
Zanella Ronald L
Home Financials for this Owner
Home Financials are based on the most recent Mortgage that was taken out on this home.
Original Mortgage
$89,600
Interest Rate
6.4%
Mortgage Type
Purchase Money Mortgage
Create a Home Valuation Report for This Property
The Home Valuation Report is an in-depth analysis detailing your home's value as well as a comparison with similar homes in the area
Home Values in the Area
Average Home Value in this Area
Purchase History
| Date | Buyer | Sale Price | Title Company |
|---|---|---|---|
| Westwood Reality Partners | $378,500 | None Available | |
| Zanella Ronald L | $115,000 | -- |
Source: Public Records
Mortgage History
| Date | Status | Borrower | Loan Amount |
|---|---|---|---|
| Previous Owner | Zanella Ronald L | $89,600 |
Source: Public Records
Tax History
| Year | Tax Paid | Tax Assessment Tax Assessment Total Assessment is a certain percentage of the fair market value that is determined by local assessors to be the total taxable value of land and additions on the property. | Land | Improvement |
|---|---|---|---|---|
| 2025 | $1,721 | $221,200 | $111,600 | $109,600 |
| 2024 | $1,460 | $139,700 | $79,700 | $60,000 |
| 2023 | $1,419 | $139,700 | $79,700 | $60,000 |
| 2022 | $1,411 | $139,700 | $79,700 | $60,000 |
| 2021 | $1,421 | $117,800 | $69,300 | $48,500 |
| 2020 | $1,396 | $117,800 | $69,300 | $48,500 |
| 2019 | $1,383 | $117,800 | $69,300 | $48,500 |
| 2018 | $1,251 | $101,300 | $69,300 | $32,000 |
| 2017 | $1,181 | $98,400 | $69,300 | $29,100 |
| 2016 | $1,181 | $98,400 | $69,300 | $29,100 |
| 2015 | $1,136 | $101,200 | $67,000 | $34,200 |
| 2014 | $1,118 | $101,200 | $67,000 | $34,200 |
Source: Public Records
Map
Nearby Homes
Your Personal Tour Guide
Ask me questions while you tour the home.