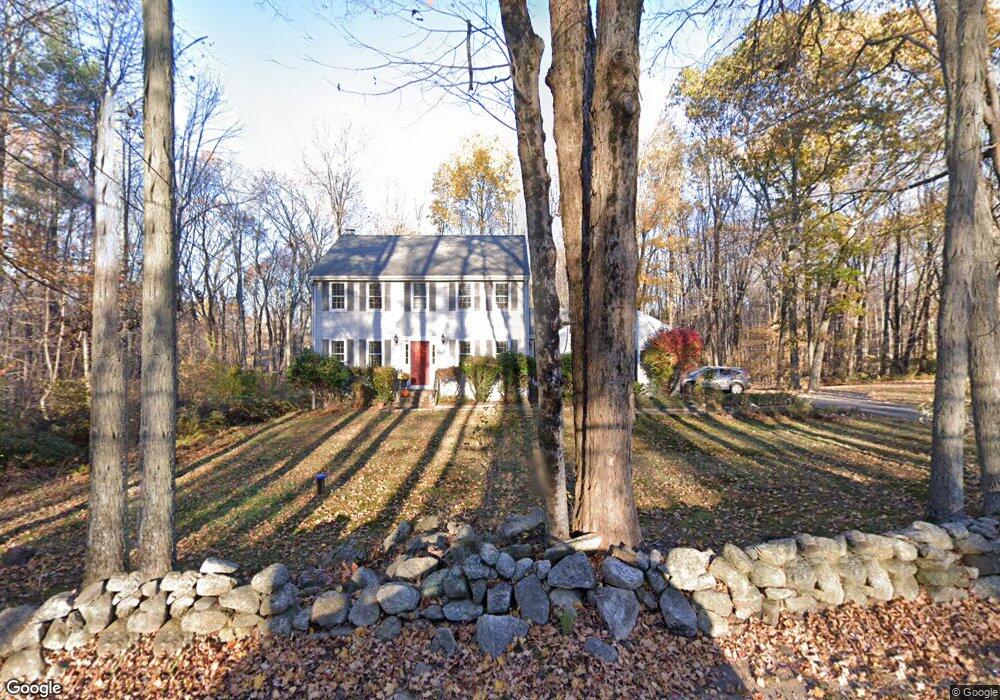
32 West St Columbia, CT 06237
Estimated Value: $276,000 - $513,000
4
Beds
3
Baths
2,174
Sq Ft
$200/Sq Ft
Est. Value
About This Home
This home is located at 32 West St, Columbia, CT 06237 and is currently estimated at $435,042, approximately $200 per square foot. 32 West St is a home located in Tolland County with nearby schools including Horace W. Porter School.
Ownership History
Date
Name
Owned For
Owner Type
Purchase Details
Closed on
Nov 10, 1998
Sold by
Derway Nancy
Bought by
Dami Paul and Derway Nancy
Current Estimated Value
Purchase Details
Closed on
Nov 3, 1987
Sold by
Disabella Frank
Bought by
Skinner George
Home Financials for this Owner
Home Financials are based on the most recent Mortgage that was taken out on this home.
Original Mortgage
$105,000
Interest Rate
10.97%
Create a Home Valuation Report for This Property
The Home Valuation Report is an in-depth analysis detailing your home's value as well as a comparison with similar homes in the area
Home Values in the Area
Average Home Value in this Area
Purchase History
| Date | Buyer | Sale Price | Title Company |
|---|---|---|---|
| Dami Paul | $65,000 | -- | |
| Skinner George | $225,000 | -- |
Source: Public Records
Mortgage History
| Date | Status | Borrower | Loan Amount |
|---|---|---|---|
| Closed | Skinner George | $80,000 | |
| Previous Owner | Skinner George | $100,000 | |
| Previous Owner | Skinner George | $100,000 | |
| Previous Owner | Skinner George | $105,000 |
Source: Public Records
Tax History
| Year | Tax Paid | Tax Assessment Tax Assessment Total Assessment is a certain percentage of the fair market value that is determined by local assessors to be the total taxable value of land and additions on the property. | Land | Improvement |
|---|---|---|---|---|
| 2025 | $7,009 | $239,470 | $61,180 | $178,290 |
| 2024 | $6,734 | $239,470 | $61,180 | $178,290 |
| 2023 | $6,205 | $239,470 | $61,180 | $178,290 |
| 2022 | $6,195 | $239,470 | $61,180 | $178,290 |
| 2021 | $5,878 | $200,400 | $61,600 | $138,800 |
| 2020 | $3,700 | $200,400 | $61,600 | $138,800 |
| 2019 | $5,878 | $200,400 | $61,600 | $138,800 |
| 2018 | $5,878 | $200,400 | $61,600 | $138,800 |
| 2017 | $5,788 | $200,400 | $61,600 | $138,800 |
| 2016 | $5,450 | $198,600 | $61,600 | $137,000 |
| 2015 | $5,388 | $198,600 | $61,600 | $137,000 |
| 2014 | $5,388 | $198,600 | $61,600 | $137,000 |
Source: Public Records
Map
Nearby Homes
Your Personal Tour Guide
Ask me questions while you tour the home.