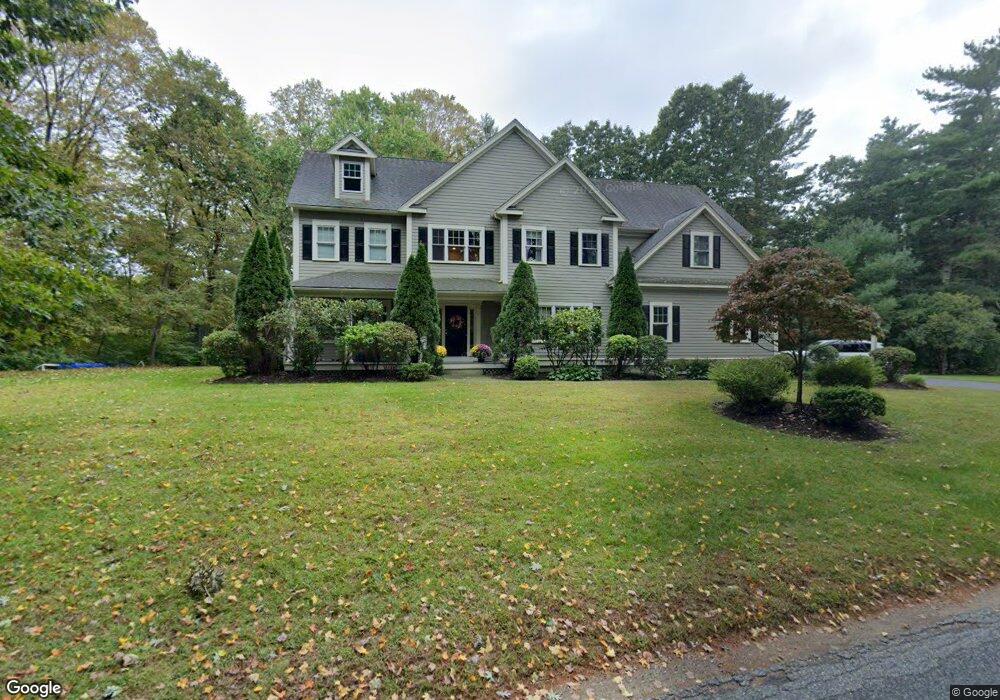
32 Wight St Medfield, MA 02052
Estimated Value: $1,702,410 - $1,849,000
About This Home
This home is located at 32 Wight St, Medfield, MA 02052 and is currently estimated at $1,787,103, approximately $408 per square foot. 32 Wight St is a home located in Norfolk County with nearby schools including Memorial School, Ralph Wheelock School, and Dale Street School.
Ownership History
We collect this data history from publicly available records. To have your information removed, we recommend requesting removal directly through your county’s website.
Purchase Details
Home Financials for this Owner
Home Financials are based on the most recent Mortgage that was taken out on this home.Purchase Details
Home Financials for this Owner
Home Financials are based on the most recent Mortgage that was taken out on this home.Home Values in the Area
Average Home Value in this Area
Purchase History
We collect this data history from publicly available records. To have your information removed, we recommend requesting removal directly through your county’s website.
| Date | Buyer | Sale Price | Title Company |
|---|---|---|---|
| $987,500 | -- | ||
| $987,500 | -- | ||
| $450,000 | -- | ||
| $450,000 | -- |
Mortgage History
We collect this data history from publicly available records. To have your information removed, we recommend requesting removal directly through your county’s website.
| Date | Status | Borrower | Loan Amount |
|---|---|---|---|
| Open | $750,000 | ||
| Closed | $750,000 | ||
| Previous Owner | $870,000 |
Tax History
We collect this data history from publicly available records. To have your information removed, we recommend requesting removal directly through your county’s website.
| Year | Tax Paid | Tax Assessment Tax Assessment Total Assessment is a certain percentage of the fair market value that is determined by local assessors to be the total taxable value of land and additions on the property. | Land | Improvement |
|---|---|---|---|---|
| 2025 | $20,147 | $1,459,900 | $424,400 | $1,035,500 |
| 2024 | $20,341 | $1,389,400 | $391,000 | $998,400 |
| 2023 | $19,852 | $1,286,600 | $372,000 | $914,600 |
| 2022 | $19,314 | $1,108,700 | $353,000 | $755,700 |
| 2021 | $18,829 | $1,060,200 | $343,500 | $716,700 |
| 2020 | $18,467 | $1,035,700 | $339,700 | $696,000 |
| 2019 | $18,054 | $1,010,300 | $330,200 | $680,100 |
| 2018 | $16,572 | $973,100 | $310,400 | $662,700 |
| 2017 | $16,321 | $966,300 | $303,600 | $662,700 |
| 2016 | $16,154 | $964,400 | $301,700 | $662,700 |
| 2015 | $15,175 | $946,100 | $354,000 | $592,100 |
| 2014 | $14,898 | $924,200 | $333,600 | $590,600 |
Map
- 60 Harding St Unit C
- 67 Blacksmith Dr
- 35 Marlyn Rd
- 23 Winter St
- 5 Stoneridge Way Unit 5
- 17 Maplewood Rd
- 29 Brastow Dr
- 123 Harding St
- 4 Lincoln Ct
- 14 Adams St Unit 14
- 3 Shining Valley Cir
- 18 Emerson Rd
- 11 Longmeadow Rd
- 44 Bridge St
- 5 Hickory Dr
- 9 Bridge St
- 5 Spring Valley Rd
- 10 Donnelly Dr
- 22 South St
- 22 Causeway St
Ask me questions while you tour the home.