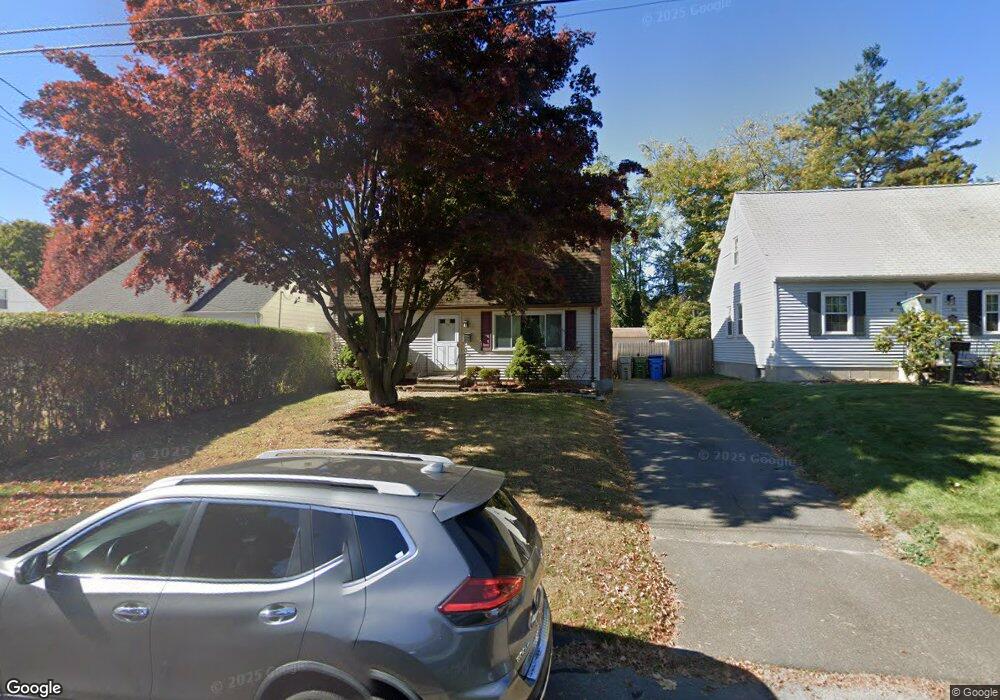
32 Wilcox St Bristol, CT 06010
South Bristol NeighborhoodEstimated Value: $309,673 - $364,000
4
Beds
2
Baths
1,382
Sq Ft
$248/Sq Ft
Est. Value
About This Home
This home is located at 32 Wilcox St, Bristol, CT 06010 and is currently estimated at $342,418, approximately $247 per square foot. 32 Wilcox St is a home located in Hartford County with nearby schools including Bristol Central High School, St. Joseph School, and Immanuel Lutheran School.
Ownership History
Date
Name
Owned For
Owner Type
Purchase Details
Closed on
Apr 26, 2019
Sold by
Kindblom Kurt
Bought by
Kindblom Christine
Current Estimated Value
Purchase Details
Closed on
Sep 9, 2002
Sold by
Circosta Dino
Bought by
Kindblom Kurt
Purchase Details
Closed on
May 28, 1999
Sold by
Rossitto Vincent J and Rossitto Carrie A
Bought by
Circosta Dino
Create a Home Valuation Report for This Property
The Home Valuation Report is an in-depth analysis detailing your home's value as well as a comparison with similar homes in the area
Home Values in the Area
Average Home Value in this Area
Purchase History
We collect this data history from publicly available records. To have your information removed, we recommend requesting removal directly through your county’s website.
| Date | Buyer | Sale Price | Title Company |
|---|---|---|---|
| Kindblom Christine | -- | -- | |
| Kindblom Kurt | $176,000 | -- | |
| Circosta Dino | $110,000 | -- |
Source: Public Records
Mortgage History
We collect this data history from publicly available records. To have your information removed, we recommend requesting removal directly through your county’s website.
| Date | Status | Borrower | Loan Amount |
|---|---|---|---|
| Previous Owner | Circosta Dino | $200,900 | |
| Previous Owner | Circosta Dino | $152,000 | |
| Previous Owner | Circosta Dino | $38,000 |
Source: Public Records
Tax History
| Year | Tax Paid | Tax Assessment Tax Assessment Total Assessment is a certain percentage of the fair market value that is determined by local assessors to be the total taxable value of land and additions on the property. | Land | Improvement |
|---|---|---|---|---|
| 2025 | $5,268 | $156,100 | $31,290 | $124,810 |
| 2024 | $4,949 | $155,400 | $31,290 | $124,110 |
| 2023 | $4,716 | $155,400 | $31,290 | $124,110 |
| 2022 | $4,209 | $109,760 | $23,660 | $86,100 |
| 2021 | $4,209 | $109,760 | $23,660 | $86,100 |
| 2020 | $4,209 | $109,760 | $23,660 | $86,100 |
| 2019 | $4,176 | $109,760 | $23,660 | $86,100 |
| 2018 | $4,048 | $109,760 | $23,660 | $86,100 |
| 2017 | $3,887 | $107,870 | $33,810 | $74,060 |
| 2016 | $3,887 | $107,870 | $33,810 | $74,060 |
| 2015 | $3,733 | $107,870 | $33,810 | $74,060 |
| 2014 | $3,733 | $107,870 | $33,810 | $74,060 |
Source: Public Records
Map
Nearby Homes
Your Personal Tour Guide
Ask me questions while you tour the home.