32 Wilson St Wareham, MA 02571
Weweantic NeighborhoodEstimated Value: $569,000 - $942,000
4
Beds
2
Baths
1,501
Sq Ft
$453/Sq Ft
Est. Value
About This Home
This home is located at 32 Wilson St, Wareham, MA 02571 and is currently estimated at $679,675, approximately $452 per square foot. 32 Wilson St is a home located in Plymouth County with nearby schools including Tabor Academy.
Ownership History
Date
Name
Owned For
Owner Type
Purchase Details
Closed on
Apr 7, 2025
Sold by
Silver Paul A
Bought by
Silver Paul A and Silver Pamela A
Current Estimated Value
Home Financials for this Owner
Home Financials are based on the most recent Mortgage that was taken out on this home.
Original Mortgage
$283,000
Outstanding Balance
$280,761
Interest Rate
6.76%
Mortgage Type
New Conventional
Estimated Equity
$398,914
Purchase Details
Closed on
May 5, 1998
Sold by
Yeomans Donald W and Yeomans Dinae E
Bought by
Silver Paul A
Create a Home Valuation Report for This Property
The Home Valuation Report is an in-depth analysis detailing your home's value as well as a comparison with similar homes in the area
Home Values in the Area
Average Home Value in this Area
Purchase History
| Date | Buyer | Sale Price | Title Company |
|---|---|---|---|
| Silver Paul A | -- | None Available | |
| Silver Paul A | -- | None Available | |
| Silver Paul A | $217,500 | -- | |
| Silver Paul A | $217,500 | -- |
Source: Public Records
Mortgage History
| Date | Status | Borrower | Loan Amount |
|---|---|---|---|
| Open | Silver Paul A | $283,000 | |
| Closed | Silver Paul A | $283,000 | |
| Previous Owner | Silver Paul A | $100,000 | |
| Previous Owner | Silver Paul A | $210,000 |
Source: Public Records
Tax History
| Year | Tax Paid | Tax Assessment Tax Assessment Total Assessment is a certain percentage of the fair market value that is determined by local assessors to be the total taxable value of land and additions on the property. | Land | Improvement |
|---|---|---|---|---|
| 2025 | $5,933 | $569,400 | $288,900 | $280,500 |
| 2024 | $5,564 | $495,500 | $216,800 | $278,700 |
| 2023 | $5,426 | $451,000 | $196,500 | $254,500 |
| 2022 | $5,223 | $396,300 | $196,500 | $199,800 |
| 2021 | $4,966 | $369,200 | $196,500 | $172,700 |
| 2020 | $4,801 | $362,100 | $196,500 | $165,600 |
| 2019 | $4,674 | $351,700 | $199,800 | $151,900 |
| 2018 | $4,497 | $329,900 | $199,800 | $130,100 |
| 2017 | $4,437 | $329,900 | $199,800 | $130,100 |
| 2016 | $5,090 | $376,200 | $259,800 | $116,400 |
| 2015 | $4,882 | $373,500 | $259,800 | $113,700 |
| 2014 | $4,504 | $350,500 | $215,400 | $135,100 |
Source: Public Records
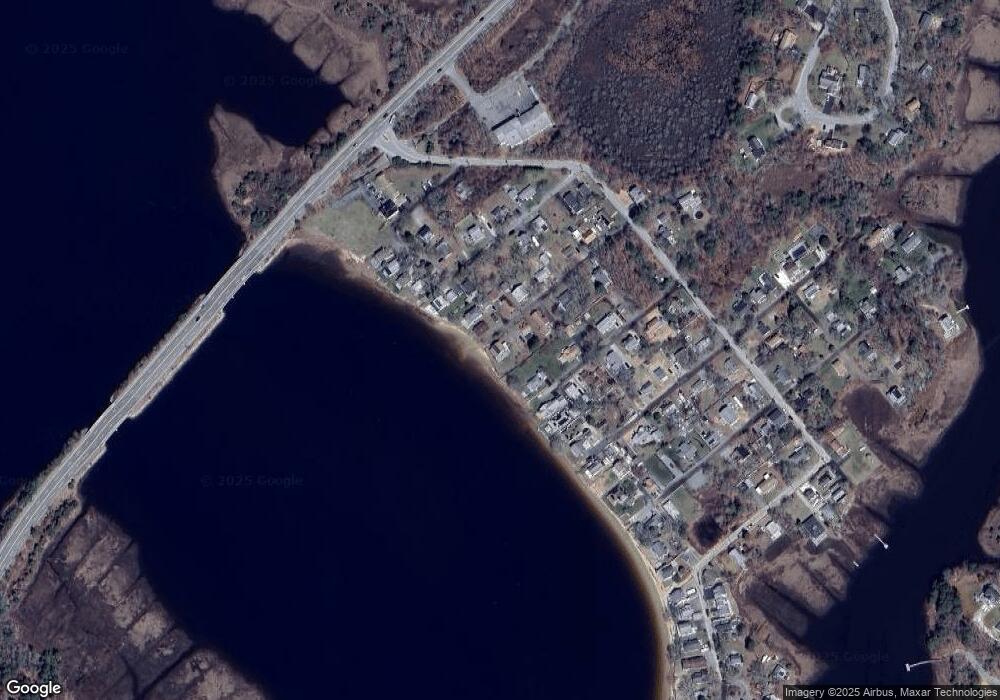
Map
Nearby Homes
- 12 Taft St
- 37 Lincoln Hwy
- 14 Briarwood Dr
- 21 Bisbee St
- 0 Cromesett Rd (Off) Unit 73385395
- 34 Pine Hill Ln
- 929 Point Rd
- 15 14th Ave
- 17 Lynne Rd
- 10 Barnes St
- 21 Bayview St
- 3 Cranberry Grove Way Unit C
- 6 Wildwood Ave
- 3 Lynne Rd
- 16 Bass Point Rd
- 6 Pine St
- 233 Marion Rd
- 4 Mather Dr
- 20 Grant St
- 43 Shore Ave
Your Personal Tour Guide
Ask me questions while you tour the home.