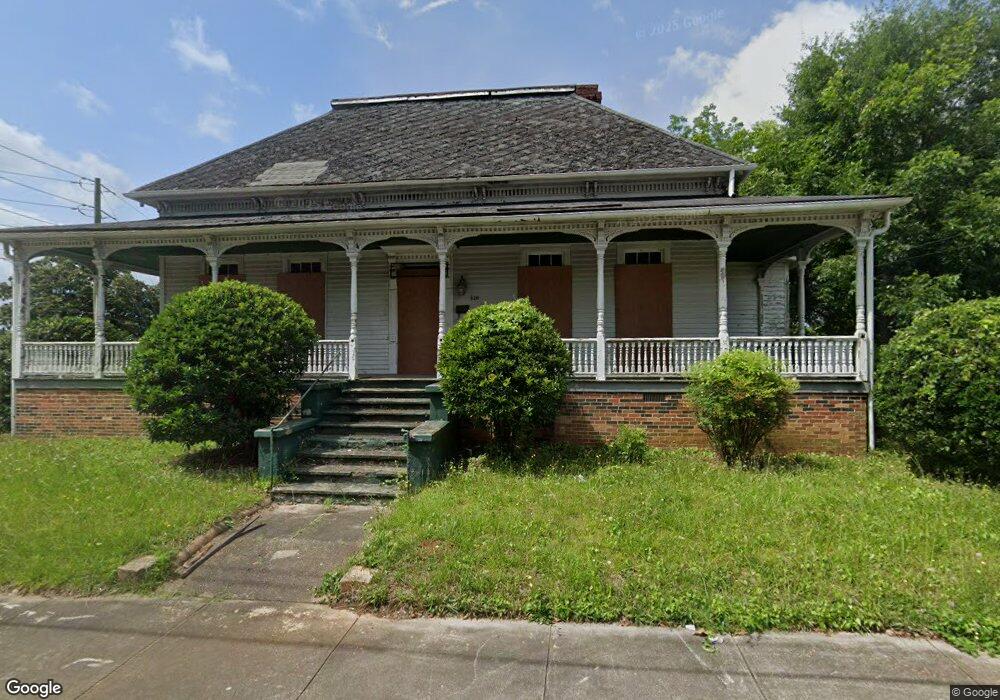
320 Hydrolia St Macon, GA 31217
East Macon Historic District NeighborhoodEstimated Value: $105,812 - $148,000
Studio
2
Baths
2,063
Sq Ft
$60/Sq Ft
Est. Value
About This Home
This home is located at 320 Hydrolia St, Macon, GA 31217 and is currently estimated at $122,953, approximately $59 per square foot. 320 Hydrolia St is a home located in Bibb County with nearby schools including Burdell Elementary School, Appling Middle School, and Northeast High School.
Ownership History
Date
Name
Owned For
Owner Type
Purchase Details
Closed on
Jul 16, 2021
Sold by
Blair Diana H
Bought by
Macon Bibb County Urban Dev Authority
Current Estimated Value
Purchase Details
Closed on
May 25, 2018
Sold by
Blair Diana H
Bought by
Blair Diana H and Diana H Blair Revocable Trust
Purchase Details
Closed on
Jul 27, 2012
Sold by
Blair Diana H
Bought by
Blair Diana H and Diana H Blair Revocable Trust
Purchase Details
Closed on
Dec 27, 1991
Sold by
Balkcom Balkcom A and Balkcom Grace
Bought by
Blair Bryan E and Blair Diana H
Create a Home Valuation Report for This Property
The Home Valuation Report is an in-depth analysis detailing your home's value as well as a comparison with similar homes in the area
Home Values in the Area
Average Home Value in this Area
Purchase History
| Date | Buyer | Sale Price | Title Company |
|---|---|---|---|
| Macon Bibb County Urban Dev Authority | $320,000 | None Available | |
| Blair Diana H | -- | None Available | |
| Blair Diana H | $81,000 | None Available | |
| Blair Diana H | -- | None Available | |
| Blair Bryan E | -- | None Available | |
| Blair Bryan E | $80,000 | -- |
Source: Public Records
Tax History
| Year | Tax Paid | Tax Assessment Tax Assessment Total Assessment is a certain percentage of the fair market value that is determined by local assessors to be the total taxable value of land and additions on the property. | Land | Improvement |
|---|---|---|---|---|
| 2025 | -- | $59,334 | $4,290 | $55,044 |
| 2024 | -- | $53,594 | $3,960 | $49,634 |
| 2023 | $0 | $52,634 | $3,000 | $49,634 |
| 2022 | $1,276 | $33,568 | $7,468 | $26,100 |
| 2021 | $675 | $17,755 | $2,801 | $14,954 |
| 2020 | $632 | $16,280 | $2,801 | $13,479 |
| 2019 | $580 | $14,805 | $2,801 | $12,004 |
| 2018 | $1,247 | $14,805 | $2,801 | $12,004 |
| 2017 | $2,103 | $56,126 | $22,198 | $33,928 |
| 2016 | $1,942 | $56,126 | $22,198 | $33,928 |
| 2015 | $2,748 | $56,126 | $22,198 | $33,928 |
| 2014 | $3,199 | $56,794 | $22,198 | $34,596 |
Source: Public Records
Map
Nearby Homes
- 242 Hydrolia St
- 466 Church St
- 325 Jones Ave
- 521 Church St
- 261 Balkcom Ave
- 789 Main St
- 336 Fairview Ave
- 781 Applewood St
- 807 Peachtree St
- 871 Peachtree St
- 692 Center St
- 363 Woolfolk St Unit 361 Woolfolk Street
- 363 AND 361 Woolfolk St
- 734 Fort Hill St
- 658 Pringle St
- 808 Center St
- 390 Cowan St
- 735 Maynard St
- 378 Cowan St
- 768 Maynard St
Your Personal Tour Guide
Ask me questions while you tour the home.