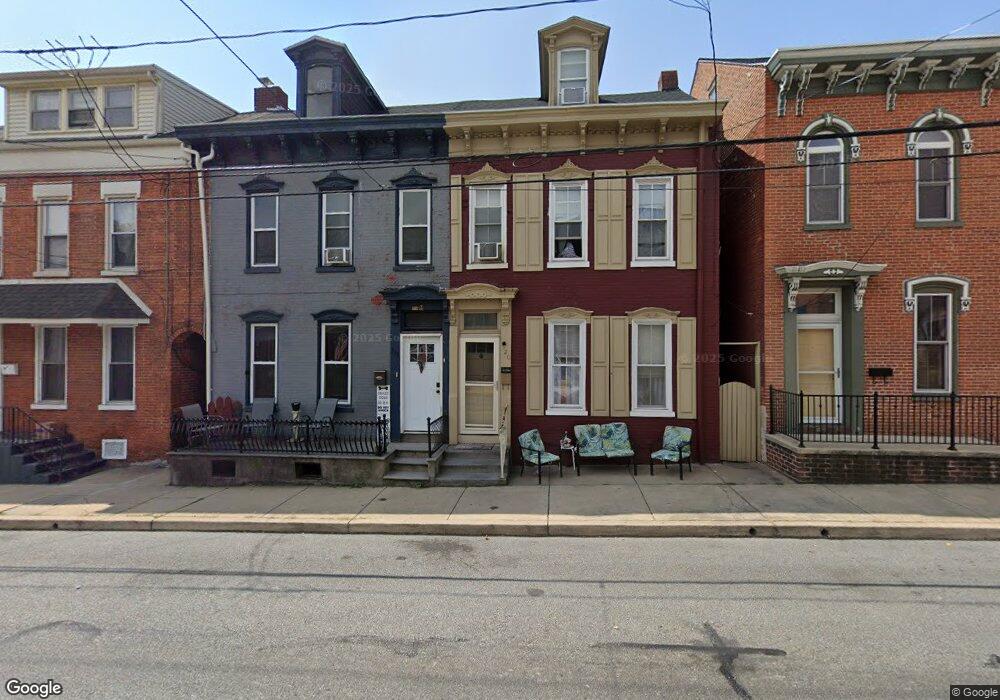
320 N 3rd St Columbia, PA 17512
Estimated Value: $177,977 - $219,000
3
Beds
1
Bath
1,731
Sq Ft
$114/Sq Ft
Est. Value
About This Home
This home is located at 320 N 3rd St, Columbia, PA 17512 and is currently estimated at $197,244, approximately $113 per square foot. 320 N 3rd St is a home located in Lancaster County with nearby schools including Columbia Middle School, Columbia High School, and Our Lady of the Angels School.
Ownership History
Date
Name
Owned For
Owner Type
Purchase Details
Closed on
Mar 3, 2006
Sold by
Hibberd John C and Hibberd Sherryl A
Bought by
John C & Sherryl A Hibberd Living Trust
Current Estimated Value
Purchase Details
Closed on
Mar 26, 1999
Sold by
Gibson Clara Mae and Markel John F
Bought by
Hibberd John C and Hibberd Sherryl A
Home Financials for this Owner
Home Financials are based on the most recent Mortgage that was taken out on this home.
Original Mortgage
$31,000
Outstanding Balance
$7,522
Interest Rate
6.78%
Estimated Equity
$189,722
Create a Home Valuation Report for This Property
The Home Valuation Report is an in-depth analysis detailing your home's value as well as a comparison with similar homes in the area
Home Values in the Area
Average Home Value in this Area
Purchase History
| Date | Buyer | Sale Price | Title Company |
|---|---|---|---|
| John C & Sherryl A Hibberd Living Trust | -- | None Available | |
| Hibberd John C | $30,100 | -- |
Source: Public Records
Mortgage History
| Date | Status | Borrower | Loan Amount |
|---|---|---|---|
| Open | Hibberd John C | $31,000 |
Source: Public Records
Tax History
| Year | Tax Paid | Tax Assessment Tax Assessment Total Assessment is a certain percentage of the fair market value that is determined by local assessors to be the total taxable value of land and additions on the property. | Land | Improvement |
|---|---|---|---|---|
| 2025 | $3,020 | $80,800 | $23,200 | $57,600 |
| 2024 | $3,020 | $80,800 | $23,200 | $57,600 |
| 2023 | $3,020 | $80,800 | $23,200 | $57,600 |
| 2022 | $3,020 | $80,800 | $23,200 | $57,600 |
| 2021 | $3,020 | $80,800 | $23,200 | $57,600 |
| 2020 | $3,020 | $80,800 | $23,200 | $57,600 |
| 2019 | $2,968 | $80,800 | $23,200 | $57,600 |
| 2018 | $2,086 | $80,800 | $23,200 | $57,600 |
| 2017 | $3,364 | $81,900 | $16,600 | $65,300 |
| 2016 | $3,364 | $81,900 | $16,600 | $65,300 |
| 2015 | $961 | $81,900 | $16,600 | $65,300 |
| 2014 | $2,310 | $81,900 | $16,600 | $65,300 |
Source: Public Records
Map
Nearby Homes
Your Personal Tour Guide
Ask me questions while you tour the home.