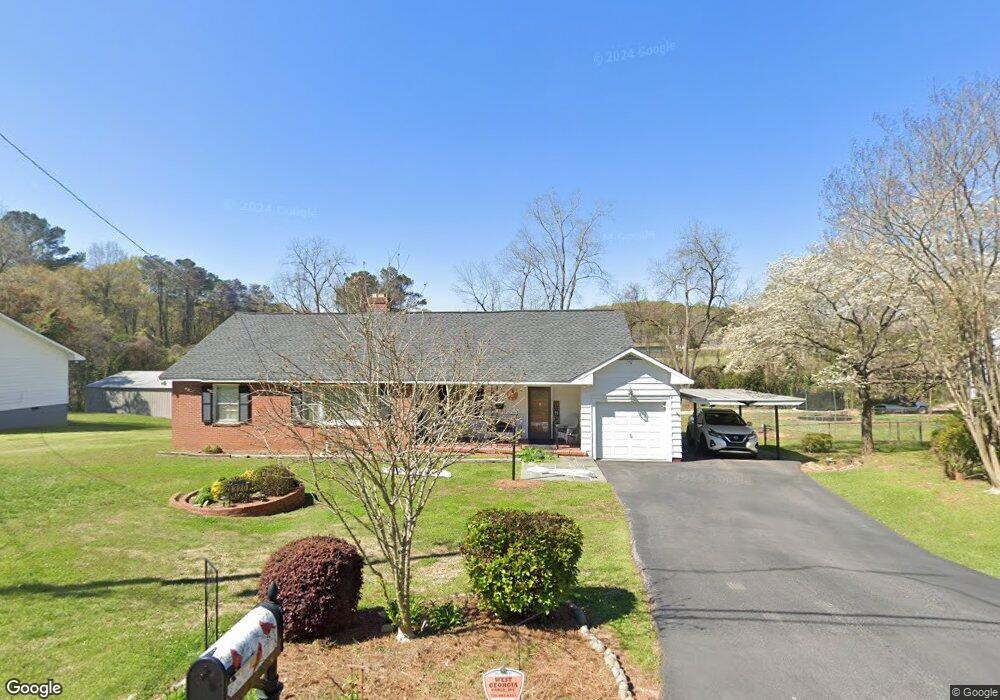
320 N Lee St Lagrange, GA 30240
Estimated Value: $229,941 - $268,000
4
Beds
2
Baths
2,006
Sq Ft
$128/Sq Ft
Est. Value
About This Home
This home is located at 320 N Lee St, Lagrange, GA 30240 and is currently estimated at $255,985, approximately $127 per square foot. 320 N Lee St is a home located in Troup County with nearby schools including Ethel W. Kight Elementary School, Hollis Hand Elementary School, and Franklin Forest Elementary School.
Ownership History
Date
Name
Owned For
Owner Type
Purchase Details
Closed on
Aug 21, 1995
Sold by
Phillip M Yearta
Bought by
Yearta Philip M
Current Estimated Value
Purchase Details
Closed on
Nov 9, 1987
Sold by
Lonnie Lonnie P and Lonnie Linda
Bought by
Phillip M Yearta
Purchase Details
Closed on
Jan 1, 1973
Sold by
James F Waugh
Bought by
Lonnie Lonnie P and Lonnie Linda
Purchase Details
Closed on
Jun 1, 1970
Sold by
Brannon Larry C and Brannon Evelyn A
Bought by
James F Waugh
Purchase Details
Closed on
Jan 1, 1966
Bought by
Brannon Larry C and Brannon Evelyn A
Create a Home Valuation Report for This Property
The Home Valuation Report is an in-depth analysis detailing your home's value as well as a comparison with similar homes in the area
Purchase History
| Date | Buyer | Sale Price | Title Company |
|---|---|---|---|
| Yearta Philip M | -- | -- | |
| Phillip M Yearta | $65,000 | -- | |
| Lonnie Lonnie P | $19,000 | -- | |
| James F Waugh | $17,000 | -- | |
| Brannon Larry C | -- | -- |
Source: Public Records
Tax History
| Year | Tax Paid | Tax Assessment Tax Assessment Total Assessment is a certain percentage of the fair market value that is determined by local assessors to be the total taxable value of land and additions on the property. | Land | Improvement |
|---|---|---|---|---|
| 2025 | $2,090 | $90,440 | $10,000 | $80,440 |
| 2024 | $1,794 | $73,600 | $10,200 | $63,400 |
| 2023 | $1,204 | $69,880 | $10,200 | $59,680 |
| 2022 | $1,294 | $63,640 | $10,200 | $53,440 |
| 2021 | $1,421 | $54,856 | $10,200 | $44,656 |
| 2020 | $1,421 | $54,856 | $10,200 | $44,656 |
| 2019 | $1,370 | $53,160 | $10,200 | $42,960 |
| 2018 | $1,360 | $52,860 | $9,900 | $42,960 |
| 2017 | $1,361 | $52,860 | $9,900 | $42,960 |
| 2016 | $1,352 | $52,572 | $9,900 | $42,672 |
| 2015 | $1,361 | $52,880 | $10,209 | $42,672 |
| 2014 | $1,294 | $50,635 | $10,209 | $40,426 |
| 2013 | -- | $51,371 | $10,209 | $41,162 |
Source: Public Records
Map
Nearby Homes
- 310 N Lee St
- 0 N Lee St Unit 10550825
- 217 Jefferson St
- 211 Moores Hill
- 0 Moores Hill
- 517 Jefferson St
- 519 Freeman St
- 202 Parker Ln
- 606 S Lee St
- 613 S Lee St
- 109 Garfield St
- 403 College Ave
- 600 Park Ave
- 311 Park Ave
- 1520 Brownwood Ave
- 304 Boulevard
- 208 Boulevard
- 812 Elm St
- 203 Waverly Way
- 207 Wilkes St
Your Personal Tour Guide
Ask me questions while you tour the home.