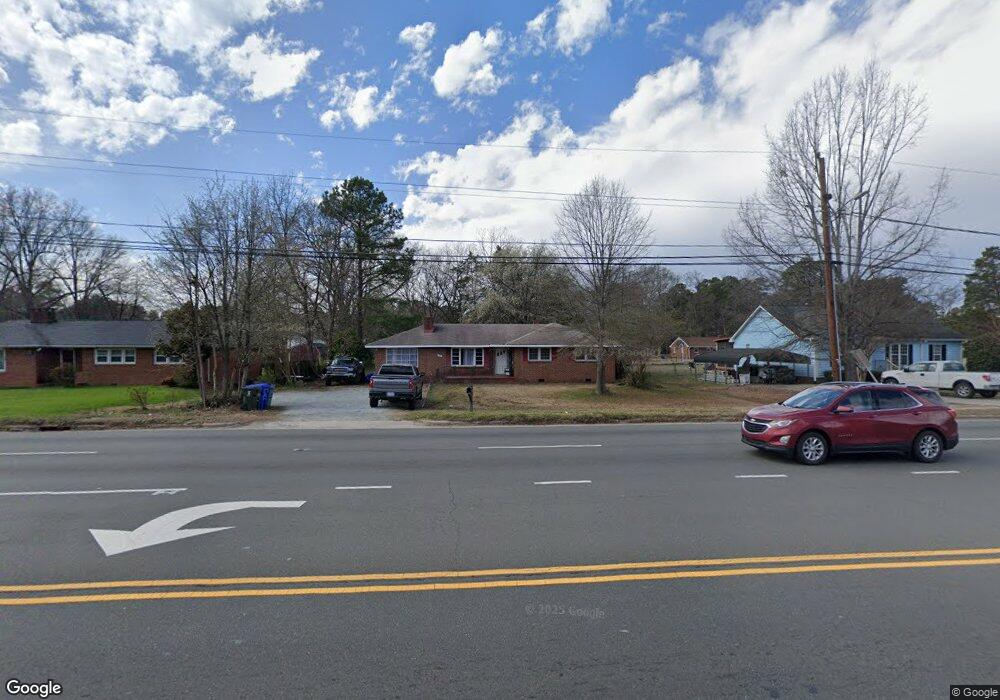
3207 N Duke St Durham, NC 27704
Duke Homestead NeighborhoodEstimated Value: $316,732 - $339,000
3
Beds
2
Baths
1,473
Sq Ft
$224/Sq Ft
Est. Value
About This Home
This home is located at 3207 N Duke St, Durham, NC 27704 and is currently estimated at $329,683, approximately $223 per square foot. 3207 N Duke St is a home located in Durham County with nearby schools including Holt Elementary, George L Carrington Middle, and Northern High School.
Create a Home Valuation Report for This Property
The Home Valuation Report is an in-depth analysis detailing your home's value as well as a comparison with similar homes in the area
Home Values in the Area
Average Home Value in this Area
Tax History
| Year | Tax Paid | Tax Assessment Tax Assessment Total Assessment is a certain percentage of the fair market value that is determined by local assessors to be the total taxable value of land and additions on the property. | Land | Improvement |
|---|---|---|---|---|
| 2025 | $3,269 | $329,755 | $154,125 | $175,630 |
| 2024 | $2,304 | $165,193 | $37,730 | $127,463 |
| 2023 | $2,164 | $165,193 | $37,730 | $127,463 |
| 2022 | $2,114 | $165,193 | $37,730 | $127,463 |
| 2021 | $2,104 | $165,193 | $37,730 | $127,463 |
| 2020 | $2,055 | $165,193 | $37,730 | $127,463 |
| 2019 | $2,055 | $165,193 | $37,730 | $127,463 |
| 2018 | $1,365 | $100,596 | $30,870 | $69,726 |
| 2017 | $1,355 | $100,596 | $30,870 | $69,726 |
| 2016 | $1,309 | $100,596 | $30,870 | $69,726 |
| 2015 | $1,647 | $118,979 | $24,036 | $94,943 |
| 2014 | $1,647 | $118,979 | $24,036 | $94,943 |
Source: Public Records
Map
Nearby Homes
- 3307 Winston Rd
- 408 W Carver St
- 312 W Carver St
- 700 W Carver St
- 3202 Shaftsbury St
- 3213 N Duke St
- 3214 Duke Homestead Rd
- 3256 Cascade Ln
- 4208 Convergence St
- 2718 Shaftsbury St
- 1812 Birmingham Ave
- 1904 Stadium Dr
- 12 Patriot Cir
- 812 Chalk Level Rd
- 30 Stonewall Way
- 35 Stonewall Way
- 11 Sweetbay Ct
- 110 W Rockway St
- 2945 Duke Homestead Rd
- 1206A River Rock Dr
- 3211 N Duke St
- 3201 N Duke St
- 3204 Winston Rd
- 3208 Winston Rd
- 3200 Winston Rd
- 3117 N Duke St
- 3212 Winston Rd
- 3116 Winston Rd
- 3113 N Duke St
- 3303 N Duke St
- 3112 Winston Rd
- 3300 Winston Rd
- 0 Diane St
- 3205 Winston Rd
- 3209 Winston Rd
- 3201 Winston Rd
- 3109 N Duke St
- 3307 N Duke St
- 3211 Winston Rd
- 3108 Winston Rd
Your Personal Tour Guide
Ask me questions while you tour the home.