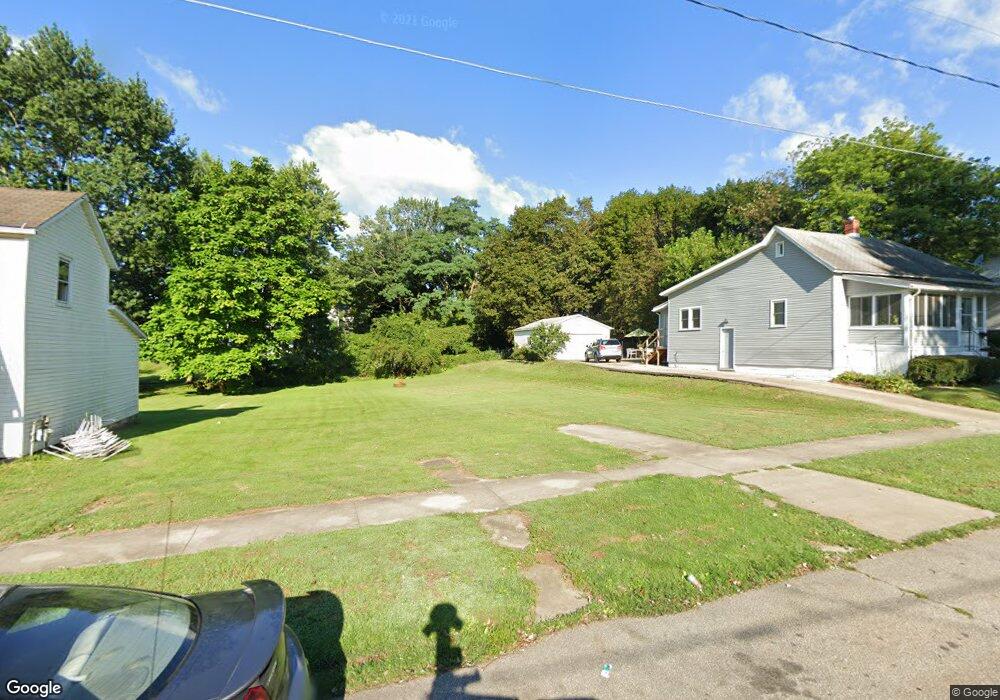
321 3rd Ave Mansfield, OH 44905
Estimated Value: $90,000 - $185,000
Studio
1
Bath
--
Sq Ft
10,498
Sq Ft Lot
About This Home
This home is located at 321 3rd Ave, Mansfield, OH 44905 and is currently estimated at $122,000. 321 3rd Ave is a home located in Richland County with nearby schools including St. Peter's Elementary/Montessori School, Temple-Christian School, and St. Peter's Junior High / High School.
Ownership History
Date
Name
Owned For
Owner Type
Purchase Details
Closed on
Oct 26, 2015
Sold by
Kelley Kenny
Bought by
Thornton Jeffrey and Thornton Joyce
Current Estimated Value
Purchase Details
Closed on
Oct 12, 2015
Sold by
Halvax William and Halvax Patricia
Bought by
Thornton Jeffrey and Thornton Joyce
Purchase Details
Closed on
Aug 27, 2015
Sold by
Bletz Dorothy J and Bletz Michael L
Bought by
Thornton Jeffrey and Thornton Joyce
Purchase Details
Closed on
Aug 30, 2013
Sold by
Estate Of Gertrude Irene Halvax
Bought by
Halvax William and Windsor Joann B
Create a Home Valuation Report for This Property
The Home Valuation Report is an in-depth analysis detailing your home's value as well as a comparison with similar homes in the area
Home Values in the Area
Average Home Value in this Area
Purchase History
| Date | Buyer | Sale Price | Title Company |
|---|---|---|---|
| Thornton Jeffrey | $100,000 | Attorney | |
| Thornton Jeffrey | $100,000 | Attorney | |
| Thornton Jeffrey | $100,000 | Attorney | |
| Thornton Jeffrey | $100,000 | Attorney | |
| Thornton Jeffrey | $100,000 | Attorney | |
| Halvax William | -- | None Available |
Source: Public Records
Tax History
| Year | Tax Paid | Tax Assessment Tax Assessment Total Assessment is a certain percentage of the fair market value that is determined by local assessors to be the total taxable value of land and additions on the property. | Land | Improvement |
|---|---|---|---|---|
| 2025 | $95 | $1,980 | $1,980 | $0 |
| 2024 | $95 | $1,980 | $1,980 | $0 |
| 2023 | $95 | $1,980 | $1,980 | $0 |
| 2022 | $114 | $2,000 | $2,000 | $0 |
| 2021 | $115 | $2,000 | $2,000 | $0 |
| 2020 | $118 | $2,000 | $2,000 | $0 |
| 2019 | $130 | $2,000 | $2,000 | $0 |
| 2018 | $129 | $2,000 | $2,000 | $0 |
| 2017 | $125 | $2,000 | $2,000 | $0 |
| 2016 | $174 | $2,690 | $2,690 | $0 |
| 2015 | $28 | $2,690 | $2,690 | $0 |
| 2014 | $164 | $2,690 | $2,690 | $0 |
| 2012 | $96 | $4,250 | $2,770 | $1,480 |
Source: Public Records
Map
Nearby Homes
- 382 Orange St
- 387 Auburn St
- 411 Grace St
- 346 Newman St
- 489 Boals Ave
- 90 Oak St
- 0 North St Unit 9072753
- 0 Lot #23128 Unit 9069815
- 266 Illinois Ave N
- 146 E 1st St
- 62 Bahl Ave
- 822 Park Ave E
- 580 N Mulberry St
- 832 Park Ave E
- 118 Raymond Ave
- 524 Lida St
- 167 S Adams St
- 195 Hedges St
- 203 Home Ave
- 223 Hedges St
Your Personal Tour Guide
Ask me questions while you tour the home.