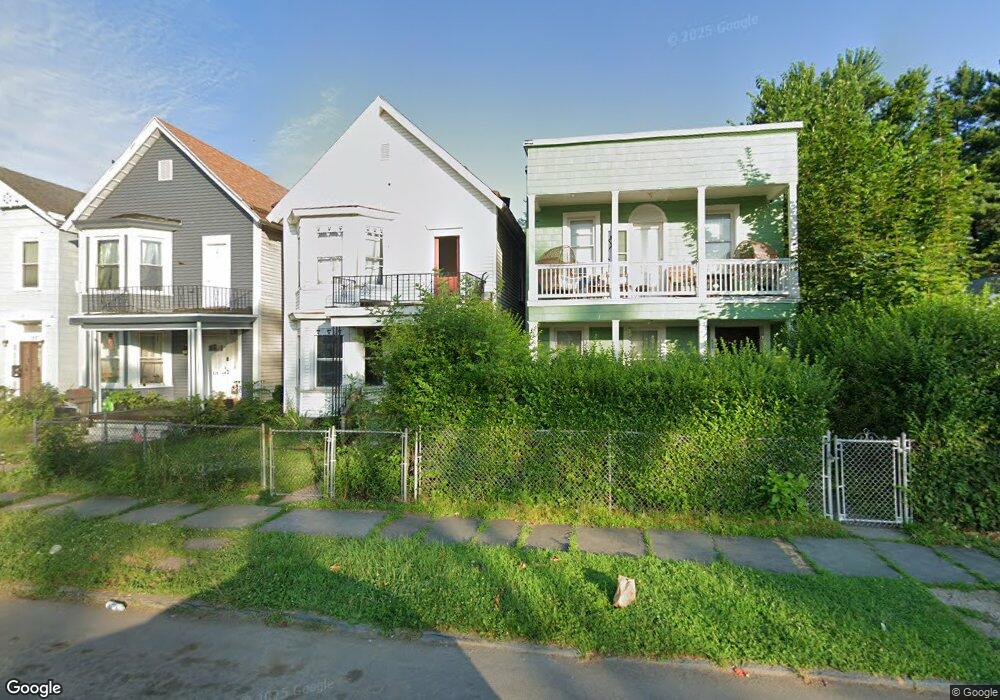
321 3rd Ave Unit 5 Troy, NY 12182
Lansingburgh NeighborhoodEstimated Value: $130,260 - $202,000
4
Beds
2
Baths
2,112
Sq Ft
$80/Sq Ft
Est. Value
About This Home
This home is located at 321 3rd Ave Unit 5, Troy, NY 12182 and is currently estimated at $169,065, approximately $80 per square foot. 321 3rd Ave Unit 5 is a home located in Rensselaer County with nearby schools including Turnpike Elementary School, Rensselaer Park Elementary School, and Knickerbacker Middle School.
Ownership History
Date
Name
Owned For
Owner Type
Purchase Details
Closed on
Aug 18, 2023
Sold by
Serenity Prop Llc
Bought by
Liddie Imani
Current Estimated Value
Home Financials for this Owner
Home Financials are based on the most recent Mortgage that was taken out on this home.
Original Mortgage
$142,500
Outstanding Balance
$138,514
Interest Rate
6.96%
Mortgage Type
Purchase Money Mortgage
Estimated Equity
$30,551
Purchase Details
Closed on
Aug 8, 2018
Sold by
Wright Diana L
Bought by
Serenity Properties Llc
Purchase Details
Closed on
Dec 20, 2002
Sold by
Betzwieser Joseph E Margarete
Bought by
Wright Diana L
Create a Home Valuation Report for This Property
The Home Valuation Report is an in-depth analysis detailing your home's value as well as a comparison with similar homes in the area
Home Values in the Area
Average Home Value in this Area
Purchase History
We collect this data history from publicly available records. To have your information removed, we recommend requesting removal directly through your county’s website.
| Date | Buyer | Sale Price | Title Company |
|---|---|---|---|
| Liddie Imani | $150,000 | None Available | |
| Liddie Imani | $150,000 | None Available | |
| Liddie Imani | $150,000 | None Available | |
| Serenity Properties Llc | $93,000 | -- | |
| Serenity Properties Llc | $93,000 | -- | |
| Serenity Properties Llc | $93,000 | -- | |
| Serenity Properties Llc | $93,000 | -- | |
| Wright Diana L | $69,500 | Dennis Feeney | |
| Wright Diana L | $69,500 | Dennis Feeney |
Source: Public Records
Mortgage History
We collect this data history from publicly available records. To have your information removed, we recommend requesting removal directly through your county’s website.
| Date | Status | Borrower | Loan Amount |
|---|---|---|---|
| Open | Liddie Imani | $142,500 | |
| Closed | Liddie Imani | $142,500 |
Source: Public Records
Tax History
| Year | Tax Paid | Tax Assessment Tax Assessment Total Assessment is a certain percentage of the fair market value that is determined by local assessors to be the total taxable value of land and additions on the property. | Land | Improvement |
|---|---|---|---|---|
| 2025 | $7,329 | $60,000 | $8,800 | $51,200 |
| 2024 | $7,329 | $60,000 | $8,800 | $51,200 |
| 2023 | $5,690 | $60,000 | $8,800 | $51,200 |
| 2022 | $2,619 | $60,000 | $8,800 | $51,200 |
| 2021 | $686 | $60,000 | $8,800 | $51,200 |
| 2020 | $1,237 | $60,000 | $8,800 | $51,200 |
| 2019 | $2,061 | $60,000 | $8,800 | $51,200 |
| 2018 | $4,174 | $60,000 | $8,800 | $51,200 |
| 2017 | $2,144 | $60,000 | $8,800 | $51,200 |
| 2016 | $2,483 | $60,000 | $8,800 | $51,200 |
| 2015 | -- | $60,000 | $8,800 | $51,200 |
| 2014 | -- | $60,000 | $8,800 | $51,200 |
Source: Public Records
Map
Nearby Homes
Your Personal Tour Guide
Ask me questions while you tour the home.