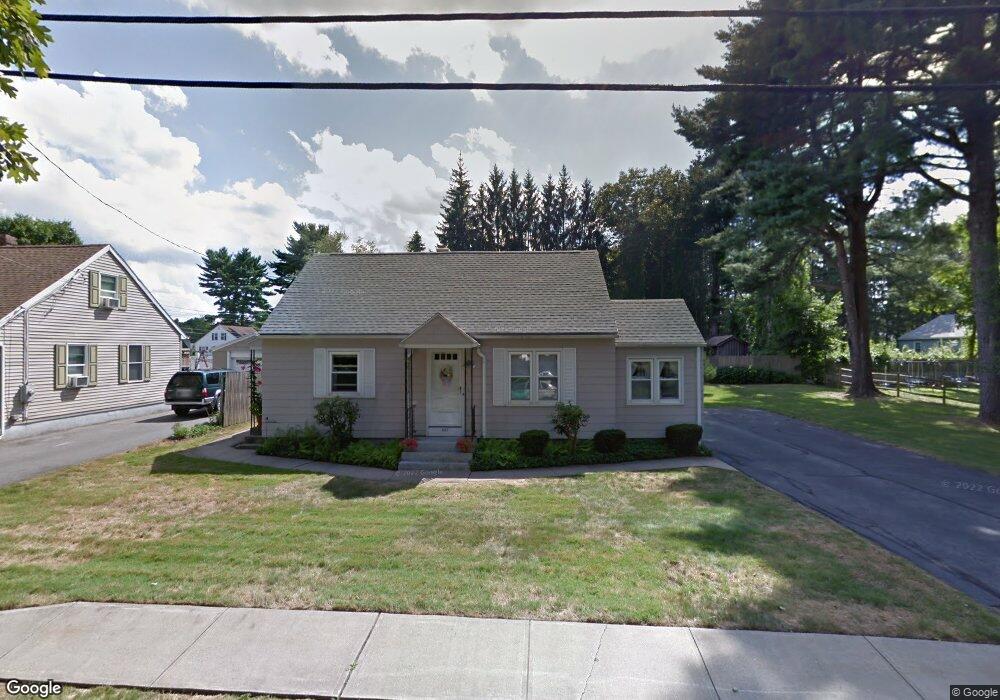
321 Chapin St Ludlow, MA 01056
Ludlow AreaEstimated Value: $297,904 - $334,000
About This Home
This home is located at 321 Chapin St, Ludlow, MA 01056 and is currently estimated at $323,226, approximately $247 per square foot. 321 Chapin St is a home located in Hampden County with nearby schools including East Street Elementary School, Chapin Street Elementary School, and Paul R. Baird Middle School.
Ownership History
We collect this data history from publicly available records. To have your information removed, we recommend requesting removal directly through your county’s website.
Purchase Details
Purchase Details
Home Values in the Area
Average Home Value in this Area
Purchase History
We collect this data history from publicly available records. To have your information removed, we recommend requesting removal directly through your county’s website.
| Date | Buyer | Sale Price | Title Company |
|---|---|---|---|
| -- | -- | ||
| $16,500 | -- |
Mortgage History
We collect this data history from publicly available records. To have your information removed, we recommend requesting removal directly through your county’s website.
| Date | Status | Borrower | Loan Amount |
|---|---|---|---|
| Previous Owner | $65,000 |
Tax History
We collect this data history from publicly available records. To have your information removed, we recommend requesting removal directly through your county’s website.
| Year | Tax Paid | Tax Assessment Tax Assessment Total Assessment is a certain percentage of the fair market value that is determined by local assessors to be the total taxable value of land and additions on the property. | Land | Improvement |
|---|---|---|---|---|
| 2025 | $4,049 | $233,400 | $73,300 | $160,100 |
| 2024 | $3,929 | $217,200 | $73,300 | $143,900 |
| 2023 | $3,637 | $186,400 | $64,300 | $122,100 |
| 2022 | $3,512 | $175,700 | $64,300 | $111,400 |
| 2021 | $3,531 | $167,500 | $64,300 | $103,200 |
| 2020 | $3,382 | $164,000 | $63,300 | $100,700 |
| 2019 | $3,153 | $159,100 | $62,700 | $96,400 |
| 2018 | $2,960 | $155,700 | $62,700 | $93,000 |
| 2017 | $2,809 | $151,600 | $61,500 | $90,100 |
| 2016 | $2,667 | $147,100 | $60,200 | $86,900 |
| 2015 | $2,502 | $144,700 | $59,600 | $85,100 |
Map
- 31 Harlan St
- 103 Laroche St
- 10 Bramucci St
- 36 Crescent Dr
- 20 Pleasant St
- 78 King St
- 92 Laconia St
- 28 Cedar St
- 299 Miller St Unit E8
- 229 Miller St Unit F-6
- 229 Miller St Unit C9
- 229 Miller St Unit D-6
- 229 Miller St Unit D-8
- 308 Miller St Unit 77
- 308 Miller St Unit 79
- 38 Prospect St
- 176 Genovevo Dr
- 2205 Boston Rd Unit C25
- 2205 Boston Rd Unit O139
- 2205 Boston Rd Unit I81
Ask me questions while you tour the home.