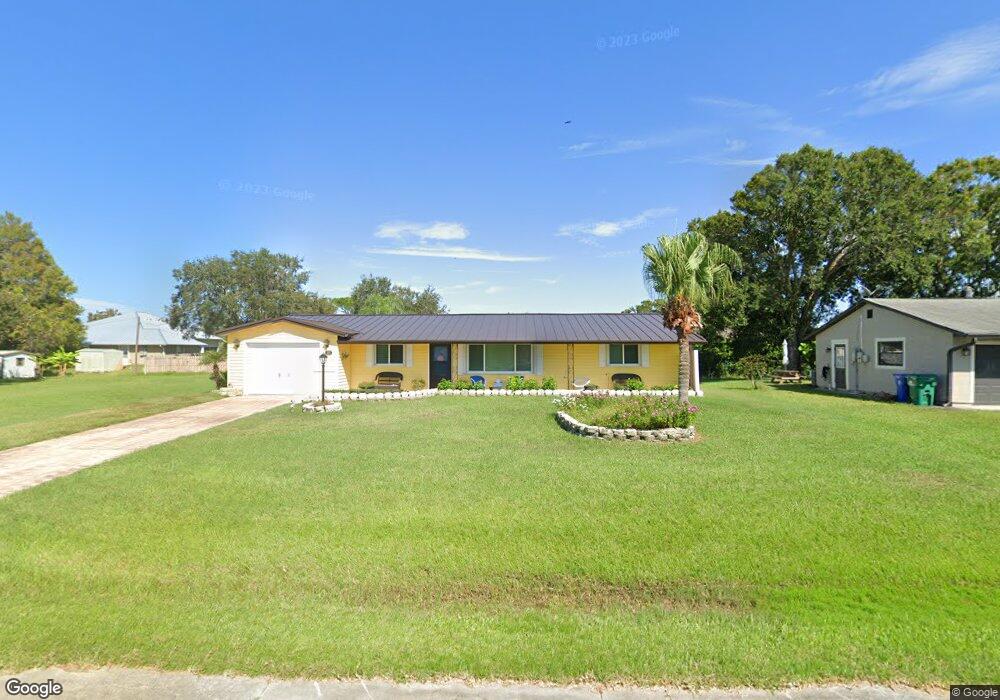
321 Fleming St Sebastian, FL 32958
Sebastian Highlands NeighborhoodEstimated Value: $278,000 - $311,000
3
Beds
2
Baths
1,368
Sq Ft
$212/Sq Ft
Est. Value
About This Home
This home is located at 321 Fleming St, Sebastian, FL 32958 and is currently estimated at $289,571, approximately $211 per square foot. 321 Fleming St is a home located in Indian River County with nearby schools including Sebastian Elementary School, Sebastian River Middle School, and Sebastian River High School.
Ownership History
Date
Name
Owned For
Owner Type
Purchase Details
Closed on
Jun 15, 2010
Sold by
Ross Matthew J and Ciolina John
Bought by
Ciolina John and Ciolina Cheryl
Current Estimated Value
Purchase Details
Closed on
Mar 6, 2009
Sold by
Barton Sallee
Bought by
Ross Matthew J and Ciolina John
Home Financials for this Owner
Home Financials are based on the most recent Mortgage that was taken out on this home.
Original Mortgage
$71,500
Interest Rate
3%
Mortgage Type
Seller Take Back
Create a Home Valuation Report for This Property
The Home Valuation Report is an in-depth analysis detailing your home's value as well as a comparison with similar homes in the area
Home Values in the Area
Average Home Value in this Area
Purchase History
We collect this data history from publicly available records. To have your information removed, we recommend requesting removal directly through your county’s website.
| Date | Buyer | Sale Price | Title Company |
|---|---|---|---|
| Ciolina John | $23,800 | Paradise Title | |
| Ross Matthew J | $90,000 | Paradise Title Llc |
Source: Public Records
Mortgage History
We collect this data history from publicly available records. To have your information removed, we recommend requesting removal directly through your county’s website.
| Date | Status | Borrower | Loan Amount |
|---|---|---|---|
| Previous Owner | Ross Matthew J | $71,500 |
Source: Public Records
Tax History
| Year | Tax Paid | Tax Assessment Tax Assessment Total Assessment is a certain percentage of the fair market value that is determined by local assessors to be the total taxable value of land and additions on the property. | Land | Improvement |
|---|---|---|---|---|
| 2025 | $1,421 | $93,770 | -- | -- |
| 2024 | $925 | $94,622 | -- | -- |
| 2023 | $925 | $81,479 | $0 | $0 |
| 2022 | $879 | $79,106 | $0 | $0 |
| 2021 | $854 | $76,802 | $0 | $0 |
| 2020 | $839 | $75,741 | $0 | $0 |
| 2019 | $726 | $58,837 | $0 | $0 |
| 2018 | $729 | $57,740 | $0 | $0 |
| 2017 | $668 | $56,553 | $0 | $0 |
| 2016 | $670 | $55,390 | $0 | $0 |
| 2015 | $689 | $55,010 | $0 | $0 |
| 2014 | $658 | $54,580 | $0 | $0 |
Source: Public Records
Map
Nearby Homes
Your Personal Tour Guide
Ask me questions while you tour the home.