Estimated Value: $251,000 - $316,000
3
Beds
2
Baths
1,134
Sq Ft
$246/Sq Ft
Est. Value
About This Home
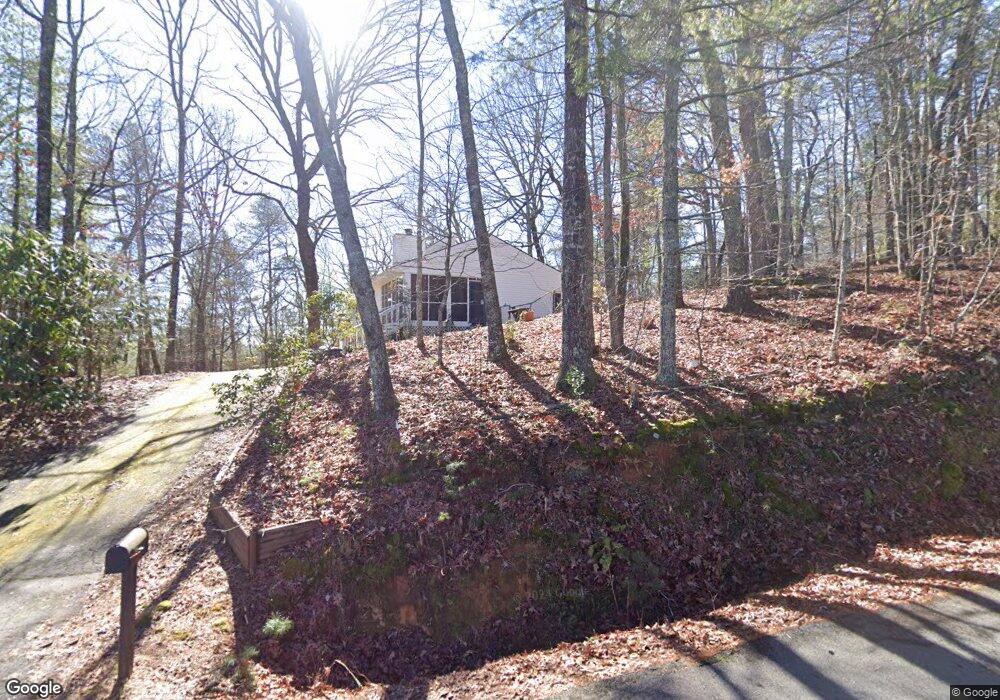
This home is located at 321 Potomac Dr, Tiger, GA 30576 and is currently estimated at $279,007, approximately $246 per square foot. 321 Potomac Dr is a home located in Rabun County with nearby schools including Rabun County Primary School and Rabun County High School.
Ownership History
Date
Name
Owned For
Owner Type
Purchase Details
Closed on
Oct 23, 2009
Sold by
Elsie Burke
Bought by
Defoor Sonja
Current Estimated Value
Home Financials for this Owner
Home Financials are based on the most recent Mortgage that was taken out on this home.
Original Mortgage
$89,320
Outstanding Balance
$57,640
Interest Rate
5.01%
Mortgage Type
VA
Estimated Equity
$221,367
Purchase Details
Closed on
Sep 24, 2009
Sold by
Sossomon Janet Allsion
Bought by
Burke Elsie L
Home Financials for this Owner
Home Financials are based on the most recent Mortgage that was taken out on this home.
Original Mortgage
$89,320
Outstanding Balance
$57,640
Interest Rate
5.01%
Mortgage Type
VA
Estimated Equity
$221,367
Purchase Details
Closed on
May 1, 1995
Purchase Details
Closed on
Mar 1, 1992
Bought by
Hust Thelma R
Purchase Details
Closed on
May 1, 1982
Create a Home Valuation Report for This Property
The Home Valuation Report is an in-depth analysis detailing your home's value as well as a comparison with similar homes in the area
Home Values in the Area
Average Home Value in this Area
Purchase History
| Date | Buyer | Sale Price | Title Company |
|---|---|---|---|
| Defoor Sonja | $88,000 | -- | |
| Defoor Sonja | $88,000 | -- | |
| Burke Elsie L | -- | -- | |
| Burke Elsie L | -- | -- | |
| -- | -- | -- | |
| -- | -- | -- | |
| Hust Thelma R | $76,000 | -- | |
| -- | $8,000 | -- | |
| -- | $8,000 | -- |
Source: Public Records
Mortgage History
| Date | Status | Borrower | Loan Amount |
|---|---|---|---|
| Open | Burke Elsie L | $89,320 | |
| Closed | Burke Elsie L | $89,320 |
Source: Public Records
Tax History
| Year | Tax Paid | Tax Assessment Tax Assessment Total Assessment is a certain percentage of the fair market value that is determined by local assessors to be the total taxable value of land and additions on the property. | Land | Improvement |
|---|---|---|---|---|
| 2025 | $843 | $55,986 | $10,000 | $45,986 |
| 2024 | $822 | $53,240 | $10,000 | $43,240 |
| 2023 | $870 | $49,549 | $10,000 | $39,549 |
| 2022 | $776 | $44,393 | $10,000 | $34,393 |
| 2021 | $714 | $40,068 | $10,000 | $30,068 |
| 2020 | $686 | $37,392 | $10,000 | $27,392 |
| 2019 | $691 | $37,392 | $10,000 | $27,392 |
| 2018 | $694 | $37,392 | $10,000 | $27,392 |
| 2017 | $665 | $37,392 | $10,000 | $27,392 |
| 2016 | $667 | $37,392 | $10,000 | $27,392 |
| 2015 | $652 | $35,869 | $10,000 | $25,869 |
| 2014 | $656 | $35,869 | $10,000 | $25,869 |
Source: Public Records
Map
Nearby Homes
- 4896 Highway 441 S
- 172 Star Mountain Dr
- 1271 & 1297 E Boggs Mountain Rd
- 18 Saga Mountain Rd
- 813 Tiger Connector
- 211 Blair St
- 141 Flying Ranch Dr
- 0 Eastman Mountain Rd Unit 10706100
- 0 Long Mountain Dr Unit LOT 1 & 3
- 172 Fred Henry Ln
- 23 Clyde Ellen Ln
- 0 River Birch Ln Unit LOT 32 10554197
- 0 Live Oak Ln Unit 8707756
- 191 Applewood Dr
- 1760 Rickman Airfield Rd
- 7118 Old 441 S
- 1063 Rickman Airfield Rd
- 63 Redwood Ln
- LOT 5 Sequoia Hills Ln Unit 5
- LOT 6 Sequoia Hills Ln Unit 6
- 302 Potomac Dr
- 245 Potomac Dr Unit 6
- 245 Potomac Dr
- 374 Potomac Dr
- 40 Stonehaven Dr
- 393 Potomac Dr
- 393 Potomac Dr Unit 13
- 410 Potomac Dr
- 168 Stonehaven Dr
- 109 Stonehaven Dr
- 425 Potomac Dr
- 114 Stonehaven Dr
- 151 Potomac Dr
- 454 Potomac Dr
- 0 Old Hwy 441 Unit 3193404
- 53 Spring House Valley Rd
- 220 Stonehaven Dr
- 481 Potomac Dr Unit 16
- 481 Potomac Dr
- 148 Potomac Dr
Your Personal Tour Guide
Ask me questions while you tour the home.