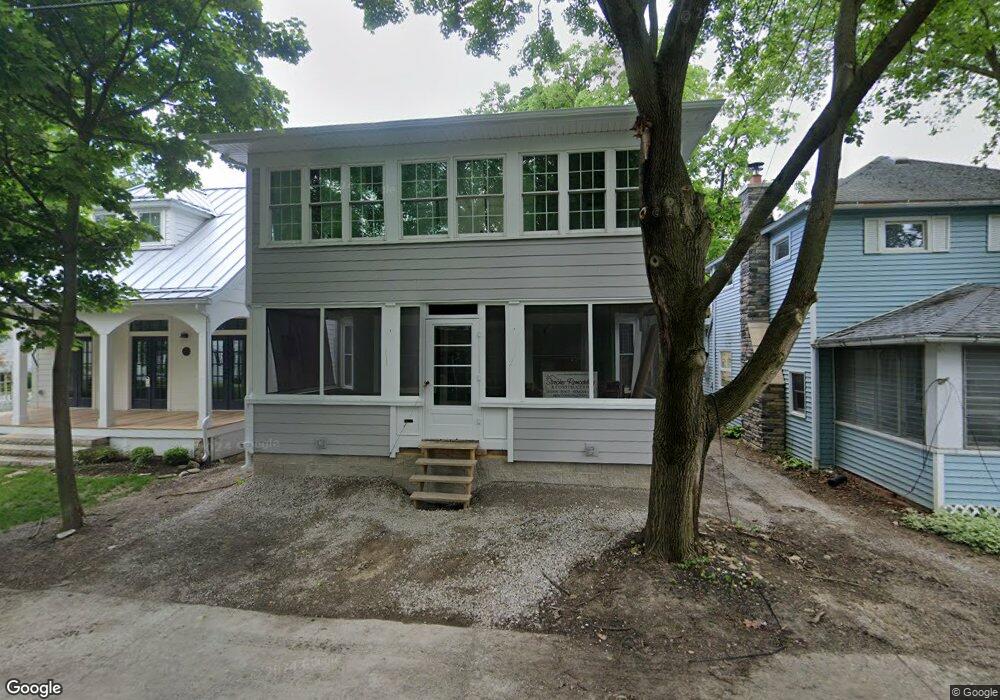
322 E 3rd St Lakeside Marblehead, OH 43440
Estimated Value: $478,090 - $722,000
3
Beds
1
Bath
1,040
Sq Ft
$582/Sq Ft
Est. Value
About This Home
This home is located at 322 E 3rd St, Lakeside Marblehead, OH 43440 and is currently estimated at $605,273, approximately $581 per square foot. 322 E 3rd St is a home located in Ottawa County with nearby schools including Danbury Middle School and Danbury High School.
Ownership History
Date
Name
Owned For
Owner Type
Purchase Details
Closed on
Jan 30, 1998
Sold by
Whitehead William A
Bought by
Fleischer John A and Fleischer Carolyn A
Current Estimated Value
Home Financials for this Owner
Home Financials are based on the most recent Mortgage that was taken out on this home.
Original Mortgage
$134,120
Outstanding Balance
$24,081
Interest Rate
7.16%
Mortgage Type
New Conventional
Estimated Equity
$581,192
Create a Home Valuation Report for This Property
The Home Valuation Report is an in-depth analysis detailing your home's value as well as a comparison with similar homes in the area
Home Values in the Area
Average Home Value in this Area
Purchase History
| Date | Buyer | Sale Price | Title Company |
|---|---|---|---|
| Fleischer John A | $167,650 | -- |
Source: Public Records
Mortgage History
| Date | Status | Borrower | Loan Amount |
|---|---|---|---|
| Open | Fleischer John A | $134,120 |
Source: Public Records
Tax History
| Year | Tax Paid | Tax Assessment Tax Assessment Total Assessment is a certain percentage of the fair market value that is determined by local assessors to be the total taxable value of land and additions on the property. | Land | Improvement |
|---|---|---|---|---|
| 2024 | $8,506 | $166,548 | $111,318 | $55,230 |
| 2023 | $5,677 | $129,280 | $101,203 | $28,077 |
| 2022 | $4,463 | $129,280 | $101,203 | $28,077 |
| 2021 | $4,477 | $129,280 | $101,200 | $28,080 |
| 2020 | $3,788 | $103,520 | $77,850 | $25,670 |
| 2019 | $3,505 | $103,520 | $77,850 | $25,670 |
| 2018 | $3,661 | $103,520 | $77,850 | $25,670 |
| 2017 | $3,363 | $93,760 | $72,400 | $21,360 |
| 2016 | $3,331 | $93,760 | $72,400 | $21,360 |
| 2015 | $3,346 | $93,760 | $72,400 | $21,360 |
| 2014 | $1,805 | $99,210 | $77,850 | $21,360 |
| 2013 | $3,362 | $99,210 | $77,850 | $21,360 |
Source: Public Records
Map
Nearby Homes
- 170 Jasmine Ave
- 336 Peach Ave
- 324 Plum Ave
- 162 Walnut Ave Unit 2
- 317 Maple Ave Unit 17
- 317 Oak Ave
- 224 Oak Ave
- 212 E 7th St
- 721 Laurel Ave
- 723 Oak Ave
- 727 Oak Ave
- 541 Oak Ave
- 715 Cherry Ave
- 1209 Prairie St
- 502 Stone St
- 608 N Monument View
- 5486 E Harbor Rd
- 280 N Lighthouse Oval
- 401 N Rockport Dr
- 340 Lighthouse Oval
Your Personal Tour Guide
Ask me questions while you tour the home.