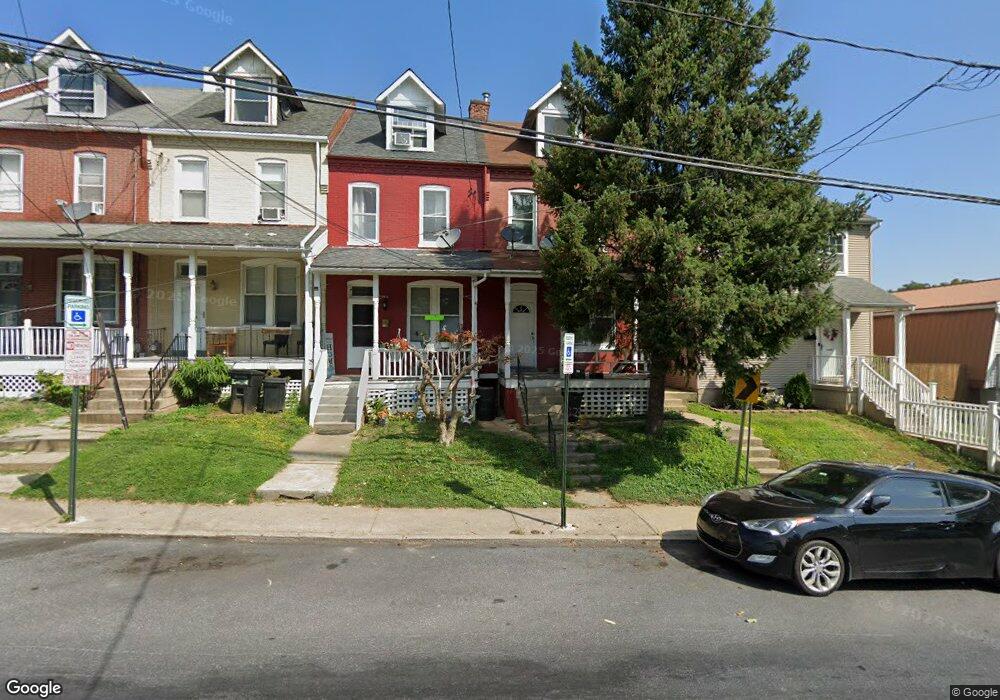
323 Hazel St Lancaster, PA 17603
Cabbage Hill NeighborhoodEstimated Value: $174,000 - $230,000
3
Beds
1
Bath
1,534
Sq Ft
$129/Sq Ft
Est. Value
About This Home
This home is located at 323 Hazel St, Lancaster, PA 17603 and is currently estimated at $197,595, approximately $128 per square foot. 323 Hazel St is a home located in Lancaster County with nearby schools including Price Elementary School, Jackson Middle School, and McCaskey High School.
Ownership History
Date
Name
Owned For
Owner Type
Purchase Details
Closed on
May 31, 2000
Sold by
Ortiz Ruth E and Caraballo Ruth E
Bought by
Caraballo Henry and Caraballo Ruth E
Current Estimated Value
Create a Home Valuation Report for This Property
The Home Valuation Report is an in-depth analysis detailing your home's value as well as a comparison with similar homes in the area
Home Values in the Area
Average Home Value in this Area
Purchase History
| Date | Buyer | Sale Price | Title Company |
|---|---|---|---|
| Caraballo Henry | -- | -- |
Source: Public Records
Tax History
| Year | Tax Paid | Tax Assessment Tax Assessment Total Assessment is a certain percentage of the fair market value that is determined by local assessors to be the total taxable value of land and additions on the property. | Land | Improvement |
|---|---|---|---|---|
| 2025 | $2,691 | $68,000 | $15,000 | $53,000 |
| 2024 | $2,691 | $68,000 | $15,000 | $53,000 |
| 2023 | $2,645 | $68,000 | $15,000 | $53,000 |
| 2022 | $2,535 | $68,000 | $15,000 | $53,000 |
| 2021 | $2,481 | $68,000 | $15,000 | $53,000 |
| 2020 | $2,481 | $68,000 | $15,000 | $53,000 |
| 2019 | $2,444 | $68,000 | $15,000 | $53,000 |
| 2018 | $1,450 | $68,000 | $15,000 | $53,000 |
| 2017 | $3,119 | $67,900 | $13,100 | $54,800 |
| 2016 | $3,090 | $67,900 | $13,100 | $54,800 |
| 2015 | $1,206 | $67,900 | $13,100 | $54,800 |
| 2014 | $2,697 | $67,900 | $13,100 | $54,800 |
Source: Public Records
Map
Nearby Homes
- 327 Hazel St
- 841 Wabank St
- 679 Poplar St
- 428 S Prince St
- 546 Poplar St
- 662 Saint Joseph St
- 348 S Prince St
- 643 Fairview Ave
- 813 Fremont St
- 529 Poplar St
- 531 S Prince St
- 610 S Prince St
- 506 Beaver St
- 522 Beaver St
- 559 S Prince St
- 931 Rolridge Ave
- 826 Saint Joseph St
- 517 Saint Joseph St
- 870 Hilton Dr
- 638 High St
Your Personal Tour Guide
Ask me questions while you tour the home.