324 Rich St Fall River, MA 02720
Bank Street NeighborhoodEstimated Value: $404,000 - $435,711
About This Home
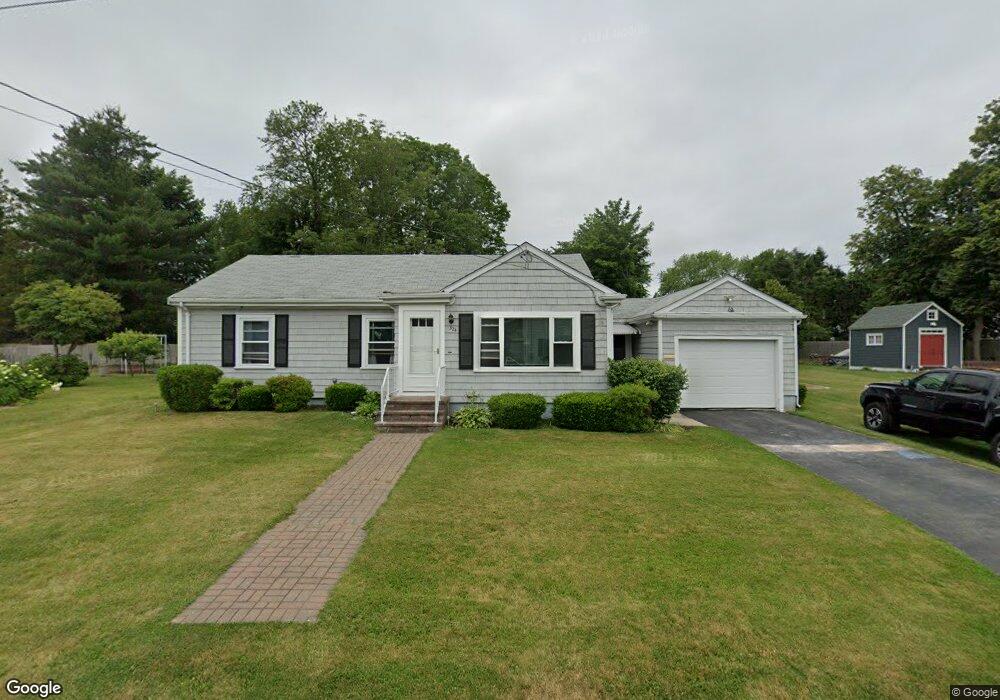
This home is located at 324 Rich St, Fall River, MA 02720 and is currently estimated at $420,928, approximately $387 per square foot. 324 Rich St is a home located in Bristol County with nearby schools including Spencer Borden Elementary School, Morton Middle School, and B M C Durfee High School.
Ownership History
We collect this data history from publicly available records. To have your information removed, we recommend requesting removal directly through your county’s website.
Purchase Details
Purchase Details
Purchase Details
Purchase Details
Home Values in the Area
Average Home Value in this Area
Purchase History
We collect this data history from publicly available records. To have your information removed, we recommend requesting removal directly through your county’s website.
| Date | Buyer | Sale Price | Title Company |
|---|---|---|---|
| -- | -- | ||
| -- | -- | ||
| -- | -- | ||
| $30,000 | -- |
Mortgage History
We collect this data history from publicly available records. To have your information removed, we recommend requesting removal directly through your county’s website.
| Date | Status | Borrower | Loan Amount |
|---|---|---|---|
| Previous Owner | $20,000 | ||
| Previous Owner | $40,000 |
Tax History
We collect this data history from publicly available records. To have your information removed, we recommend requesting removal directly through your county’s website.
| Year | Tax Paid | Tax Assessment Tax Assessment Total Assessment is a certain percentage of the fair market value that is determined by local assessors to be the total taxable value of land and additions on the property. | Land | Improvement |
|---|---|---|---|---|
| 2025 | $4,070 | $355,500 | $134,600 | $220,900 |
| 2024 | $3,825 | $332,900 | $129,400 | $203,500 |
| 2023 | $3,670 | $299,100 | $116,200 | $182,900 |
| 2022 | $3,498 | $277,200 | $107,500 | $169,700 |
| 2021 | $3,521 | $254,600 | $101,500 | $153,100 |
| 2020 | $3,397 | $235,100 | $97,800 | $137,300 |
| 2019 | $3,297 | $226,100 | $97,800 | $128,300 |
| 2018 | $3,250 | $222,300 | $97,800 | $124,500 |
| 2017 | $3,083 | $220,200 | $97,800 | $122,400 |
| 2016 | $2,921 | $214,300 | $97,800 | $116,500 |
| 2015 | $2,719 | $207,900 | $91,400 | $116,500 |
| 2014 | $2,615 | $207,900 | $91,400 | $116,500 |
Map
- 251 Rich St
- 1243 New Boston Rd
- 1163 New Boston Rd
- 128 Windsor St
- 166 Stonehaven Rd
- 235 Chavenson St
- 65-67 Farnham St
- 45 Read St
- 124 Downing St
- 79 Woodlawn St
- 956 Maple St
- 37 Shawmut St
- 14 Downing St
- 1017 Pine St
- 615 Robeson St
- 1231 Robeson St
- 301 Madison St
- 212 Haffards St
- 51 Summerfield St
- 793 Montgomery St
Ask me questions while you tour the home.