325 8th St Saddle Brook, NJ 07663
Saddle Brook AreaEstimated Value: $546,000 - $690,000
About This Home
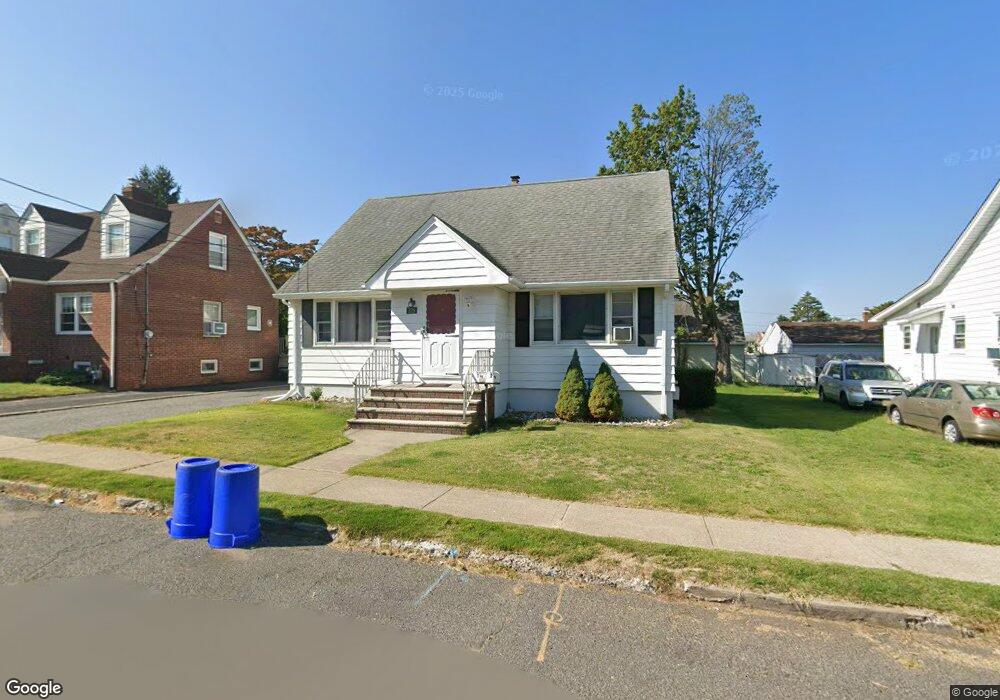
This home is located at 325 8th St, Saddle Brook, NJ 07663 and is currently estimated at $638,172, approximately $391 per square foot. 325 8th St is a home located in Bergen County with nearby schools including Saddle Brook Mid High School and Bergen Arts and Sciences Charter School.
Ownership History
We collect this data history from publicly available records. To have your information removed, we recommend requesting removal directly through your county’s website.
Purchase Details
Purchase Details
Purchase Details
Home Financials for this Owner
Home Financials are based on the most recent Mortgage that was taken out on this home.Home Values in the Area
Average Home Value in this Area
Purchase History
We collect this data history from publicly available records. To have your information removed, we recommend requesting removal directly through your county’s website.
| Date | Buyer | Sale Price | Title Company |
|---|---|---|---|
| -- | Westcor Land Title Insurance | ||
| $365,000 | Westcor Land Title | ||
| $370,000 | -- |
Mortgage History
We collect this data history from publicly available records. To have your information removed, we recommend requesting removal directly through your county’s website.
| Date | Status | Borrower | Loan Amount |
|---|---|---|---|
| Previous Owner | $290,000 |
Tax History
We collect this data history from publicly available records. To have your information removed, we recommend requesting removal directly through your county’s website.
| Year | Tax Paid | Tax Assessment Tax Assessment Total Assessment is a certain percentage of the fair market value that is determined by local assessors to be the total taxable value of land and additions on the property. | Land | Improvement |
|---|---|---|---|---|
| 2026 | $10,085 | $492,200 | $231,500 | $260,700 |
| 2025 | $9,540 | $425,000 | $225,000 | $200,000 |
| 2024 | $8,629 | $413,700 | $220,000 | $193,700 |
| 2023 | $8,085 | $369,400 | $200,500 | $168,900 |
| 2022 | $8,085 | $336,600 | $175,300 | $161,300 |
| 2021 | $7,822 | $300,400 | $150,600 | $149,800 |
| 2020 | $7,524 | $292,200 | $147,100 | $145,100 |
| 2019 | $7,486 | $288,700 | $144,600 | $144,100 |
| 2018 | $7,324 | $288,700 | $145,600 | $143,100 |
| 2017 | $7,350 | $285,100 | $143,100 | $142,000 |
| 2016 | $7,698 | $268,700 | $133,100 | $135,600 |
| 2015 | $7,295 | $268,700 | $133,100 | $135,600 |
| 2014 | $7,040 | $268,700 | $133,100 | $135,600 |
Map
- 271 Outwater Ln
- 472 Macarthur Ave Unit 5
- 192 N 6th St
- 23 Park Ave
- 316 S Boulevard
- 301 South Blvd
- 295 Lanza Ave
- 271 South Blvd
- 147 N 7th St
- 76 Hamilton Ave
- 169 Plauderville Ave
- 295 Malcolm Ave
- 409 Farnham Ave
- 182 Midland Ave
- 161 Plauderville Ave
- 391 Macarthur Ave
- 290 Malcolm Ave
- 280 Malcolm Ave
- 12 Pleasant Ave
- 374 Semel Ave
Ask me questions while you tour the home.