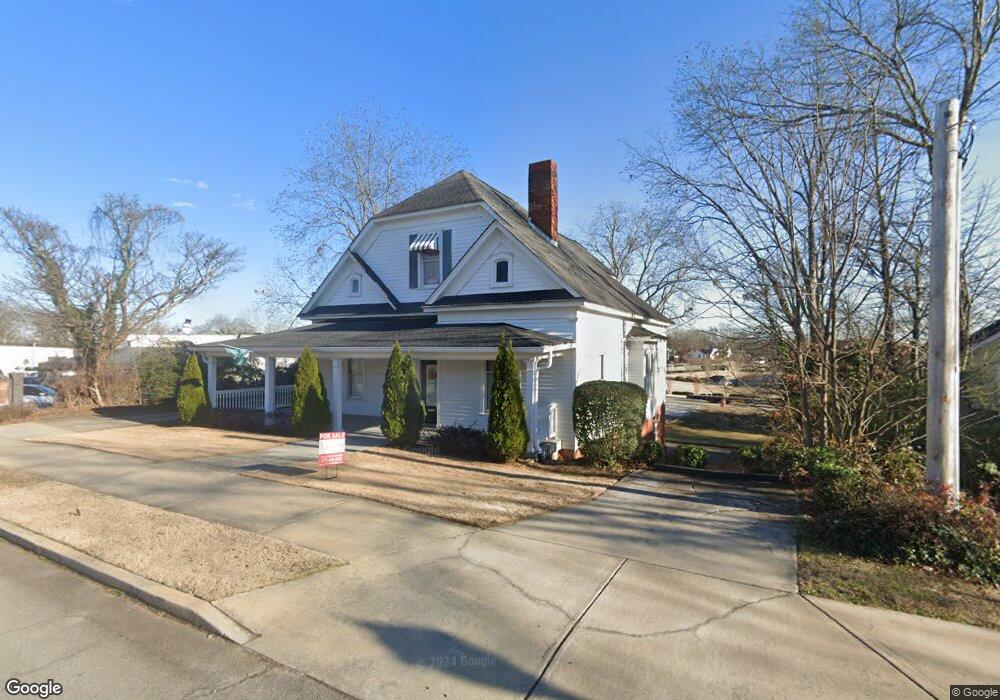
326 W Main St Buford, GA 30518
Estimated Value: $752,000 - $833,730
3
Beds
1
Bath
2,164
Sq Ft
$366/Sq Ft
Est. Value
About This Home
This home is located at 326 W Main St, Buford, GA 30518 and is currently estimated at $792,865, approximately $366 per square foot. 326 W Main St is a home located in Gwinnett County with nearby schools including Buford Elementary School, Buford Senior Academy, and Buford Academy.
Ownership History
Date
Name
Owned For
Owner Type
Purchase Details
Closed on
May 15, 2024
Sold by
Law Vol Llc
Bought by
326 W Main Street Llc
Current Estimated Value
Home Financials for this Owner
Home Financials are based on the most recent Mortgage that was taken out on this home.
Original Mortgage
$680,000
Outstanding Balance
$319,551
Interest Rate
6.88%
Mortgage Type
New Conventional
Estimated Equity
$473,314
Purchase Details
Closed on
May 5, 2014
Sold by
326 West Llc
Bought by
Law Vol Llc
Home Financials for this Owner
Home Financials are based on the most recent Mortgage that was taken out on this home.
Original Mortgage
$162,331
Interest Rate
4.44%
Mortgage Type
Commercial
Purchase Details
Closed on
Oct 27, 2006
Sold by
Sunderland T Stanley
Bought by
326 West Llc
Purchase Details
Closed on
Oct 26, 2005
Sold by
Sunderland Nancy R
Bought by
Sunderland T Stanley
Create a Home Valuation Report for This Property
The Home Valuation Report is an in-depth analysis detailing your home's value as well as a comparison with similar homes in the area
Home Values in the Area
Average Home Value in this Area
Purchase History
| Date | Buyer | Sale Price | Title Company |
|---|---|---|---|
| 326 W Main Street Llc | $850,000 | -- | |
| Law Vol Llc | $195,000 | -- | |
| 326 West Llc | $125,000 | -- | |
| Sunderland T Stanley | -- | -- |
Source: Public Records
Mortgage History
| Date | Status | Borrower | Loan Amount |
|---|---|---|---|
| Open | 326 W Main Street Llc | $680,000 | |
| Previous Owner | Law Vol Llc | $162,331 |
Source: Public Records
Tax History
| Year | Tax Paid | Tax Assessment Tax Assessment Total Assessment is a certain percentage of the fair market value that is determined by local assessors to be the total taxable value of land and additions on the property. | Land | Improvement |
|---|---|---|---|---|
| 2025 | -- | $257,000 | $112,400 | $144,600 |
| 2024 | $1,565 | $109,080 | $78,680 | $30,400 |
| 2023 | $1,565 | $171,600 | $60,880 | $110,720 |
| 2022 | $2,061 | $143,600 | $51,600 | $92,000 |
| 2021 | $1,358 | $94,640 | $74,600 | $20,040 |
| 2020 | $1,358 | $94,640 | $74,600 | $20,040 |
| 2019 | $1,226 | $94,640 | $74,600 | $20,040 |
| 2018 | $736 | $56,800 | $33,920 | $22,880 |
| 2016 | $728 | $56,800 | $33,920 | $22,880 |
| 2015 | $754 | $56,800 | $33,920 | $22,880 |
| 2014 | $766 | $56,800 | $33,920 | $22,880 |
Source: Public Records
Map
Nearby Homes
- 335 W Moreno St
- 306 W Main St
- 336 W Main St
- 6468 Crest Brook Way
- 1969 Rowland Pass
- 2009 Rowland Pass
- 1810 Rowland Pass
- 1830 Rowland Pass
- 1900 Rowland Pass
- 1909 Rowland Pass
- 1889 Rowland Pass
- 1879 Rowland Pass
- 1899 Rowland Pass
- 1919 Rowland Pass
- 1870 Rowland Pass
- 1780 Rowland Pass
- 2039 Rowland Pass
- 1809 Rowland Pass
- 6441 Crest Brook Way
- 6411 Crest Brook Way
Your Personal Tour Guide
Ask me questions while you tour the home.