
Seller's Agent in 2020
Timothy D'Ascenzo
HomeSmart First Advantage Realty
(609) 491-5334
1 in this area
9 Total Sales

Estimated Value: $733,000 - $1,038,000
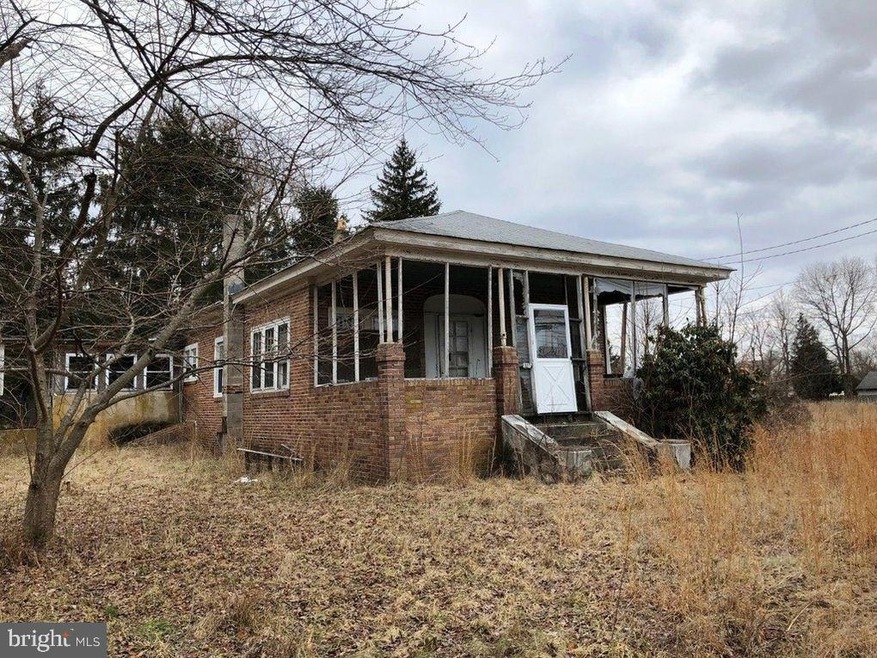
3 Bed 1 Bath Ranch with Detached Inlaw/ Man cave building. ( Included in Twp Taxable SQFT) This sale includes additional lot in Winslow Twp for total acres of +/- 12.7. The PIQ falls on Waterford Twp lot and is part of Waterford Twp Schools.
Last Agent to Sell the Property
(856) 363-3000 hakankarahan@hakankarahan.com HomeSmart First Advantage Realty Listed on: 03/19/2020
Last Buyer's Agent
(856) 663-9100 mhartery21@gmail.com Peze & Associates License #9590284
We collect this data history from publicly available records. To have your information removed, we recommend requesting removal directly through your county’s website.
We collect this data history from publicly available records. To have your information removed, we recommend requesting removal directly through your county’s website.
| Date | Buyer | Sale Price | Title Company |
|---|---|---|---|
| $385,000 | Founders Title | ||
| $100,000 | Sjs Title Llc | ||
| $40,000 | Sjs Title Llc | ||
| $70,000 | American Title Abstract Corp |
We collect this data history from publicly available records. To have your information removed, we recommend requesting removal directly through your county’s website.
| Date | Status | Borrower | Loan Amount |
|---|---|---|---|
| Previous Owner | $468,000 | ||
| Previous Owner | $50,000 |
We collect this data history from publicly available records. To have your information removed, we recommend requesting removal directly through your county’s website.
| Date | Event | Price | List to Sale | Price per Sq Ft | Prior Sale |
|---|---|---|---|---|---|
| 03/19/2020 03/19/20 | Sold | $100,000 | 0.0% | $49 / Sq Ft | |
| 03/19/2020 03/19/20 | Pending | -- | -- | -- | |
| 03/19/2020 03/19/20 | For Sale | $100,000 | +42.9% | $49 / Sq Ft | |
| 06/07/2018 06/07/18 | Sold | $70,000 | -20.4% | $35 / Sq Ft | View Prior Sale |
| 05/18/2018 05/18/18 | Pending | -- | -- | -- | |
| 02/07/2018 02/07/18 | For Sale | $87,900 | -- | $43 / Sq Ft |
We collect this data history from publicly available records. To have your information removed, we recommend requesting removal directly through your county’s website.
| Year | Tax Paid | Tax Assessment Tax Assessment Total Assessment is a certain percentage of the fair market value that is determined by local assessors to be the total taxable value of land and additions on the property. | Land | Improvement |
|---|---|---|---|---|
| 2025 | $9,362 | $205,300 | $78,100 | $127,200 |
| 2024 | $8,822 | $205,300 | $78,100 | $127,200 |
| 2023 | $8,822 | $205,300 | $78,100 | $127,200 |
| 2022 | $8,430 | $205,300 | $78,100 | $127,200 |
| 2021 | $8,389 | $205,300 | $78,100 | $127,200 |
| 2020 | $8,348 | $205,300 | $78,100 | $127,200 |
| 2019 | $8,220 | $205,300 | $78,100 | $127,200 |
| 2018 | $8,212 | $205,300 | $78,100 | $127,200 |
| 2017 | $8,085 | $205,300 | $78,100 | $127,200 |
| 2016 | $7,968 | $205,300 | $78,100 | $127,200 |
| 2015 | $7,758 | $205,300 | $78,100 | $127,200 |
| 2014 | $8,690 | $166,400 | $72,400 | $94,000 |
Seller's Agent in 2020
Timothy D'Ascenzo
HomeSmart First Advantage Realty
(609) 491-5334
1 in this area
9 Total Sales
Buyer's Agent in 2020
Michaela Hartery
Peze & Associates
(856) 912-2973
2 in this area
164 Total Sales
Seller's Agent in 2018
Dennis Kain
Century 21 Reilly Realtors
(856) 753-0198
22 in this area
72 Total Sales
J
Buyer's Agent in 2018
Jaago Viitkin
EXP Realty, LLC
Source: Bright MLS
MLS Number: NJCD390358
APN: 35-02205-0000-00002
Disclaimer: Certain information contained herein is derived from information provided by parties other than Homes.com. All information provided is deemed reliable, but is not guaranteed to be accurate and should be independently verified.
![]() The data relating to real estate for sale on this website appears in part through the BRIGHT Internet Data Exchange program, a voluntary cooperative exchange of property listing data between licensed real estate brokerage firms, and is provided by BRIGHT through a licensing agreement.
The data relating to real estate for sale on this website appears in part through the BRIGHT Internet Data Exchange program, a voluntary cooperative exchange of property listing data between licensed real estate brokerage firms, and is provided by BRIGHT through a licensing agreement.
Listing information is from various brokers who participate in the Bright MLS IDX program and not all listings may be visible on the site.
The property information being provided on or through the website is for the personal, non-commercial use of consumers and such information may not be used for any purpose other than to identify prospective properties consumers may be interested in purchasing.
Some properties which appear for sale on the website may no longer be available because they are for instance, under contract, sold or are no longer being offered for sale.
Property information displayed is deemed reliable but is not guaranteed.
Copyright 2026 Bright MLS, Inc.
Ask me questions while you tour the home.