Estimated Value: $397,000 - $408,000
About This Home
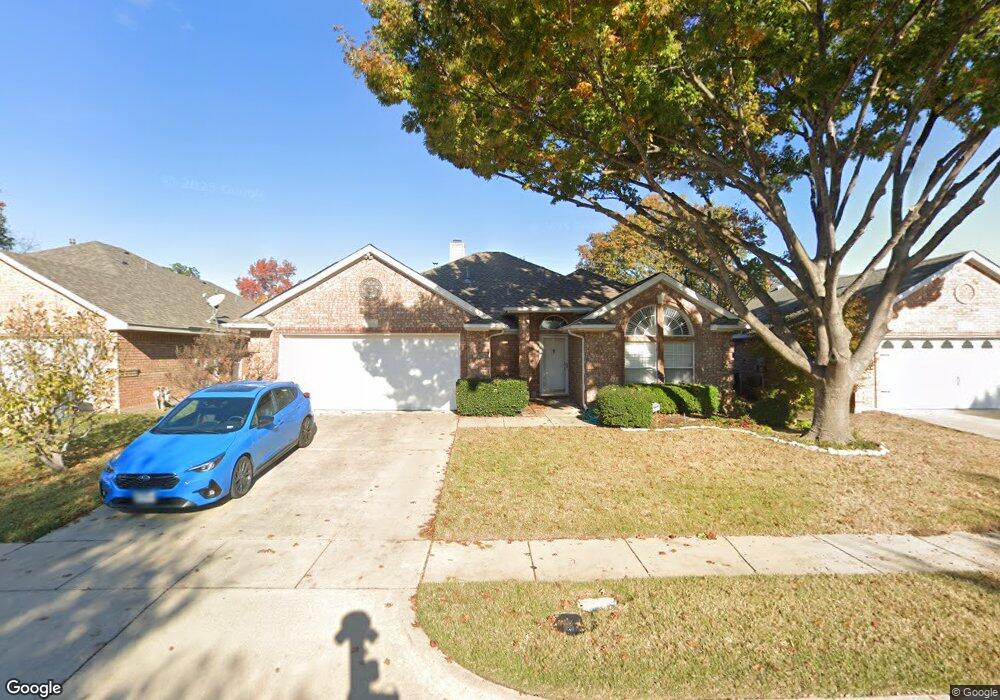
This home is located at 328 Chantilly Ct, Hurst, TX 76054 and is currently estimated at $401,261, approximately $211 per square foot. 328 Chantilly Ct is a home located in Tarrant County with nearby schools including Shady Oaks Elementary School, Bedford Junior High School, and L.D. Bell High School.
Ownership History
We collect this data history from publicly available records. To have your information removed, we recommend requesting removal directly through your county’s website.
Purchase Details
Purchase Details
Purchase Details
Purchase Details
Home Financials for this Owner
Home Financials are based on the most recent Mortgage that was taken out on this home.Home Values in the Area
Average Home Value in this Area
Purchase History
We collect this data history from publicly available records. To have your information removed, we recommend requesting removal directly through your county’s website.
| Date | Buyer | Sale Price | Title Company |
|---|---|---|---|
| -- | None Listed On Document | ||
| -- | -- | ||
| -- | -- | ||
| -- | -- |
Mortgage History
We collect this data history from publicly available records. To have your information removed, we recommend requesting removal directly through your county’s website.
| Date | Status | Borrower | Loan Amount |
|---|---|---|---|
| Previous Owner | $93,000 |
Tax History
We collect this data history from publicly available records. To have your information removed, we recommend requesting removal directly through your county’s website.
| Year | Tax Paid | Tax Assessment Tax Assessment Total Assessment is a certain percentage of the fair market value that is determined by local assessors to be the total taxable value of land and additions on the property. | Land | Improvement |
|---|---|---|---|---|
| 2025 | $8,382 | $398,314 | $75,000 | $323,314 |
| 2024 | $8,136 | $398,314 | $75,000 | $323,314 |
| 2023 | $7,559 | $377,292 | $40,000 | $337,292 |
| 2022 | $7,703 | $345,742 | $40,000 | $305,742 |
| 2021 | $7,335 | $304,138 | $40,000 | $264,138 |
| 2020 | $6,727 | $293,909 | $40,000 | $253,909 |
| 2019 | $6,221 | $295,735 | $40,000 | $255,735 |
| 2018 | $3,288 | $231,062 | $40,000 | $191,062 |
| 2017 | $5,316 | $297,145 | $40,000 | $257,145 |
| 2016 | $4,832 | $199,917 | $40,000 | $159,917 |
| 2015 | $4,067 | $173,600 | $25,000 | $148,600 |
| 2014 | $4,067 | $173,600 | $25,000 | $148,600 |
Map
- 329 Stratford Dr
- 330 W Harwood Rd Unit D
- 305 Chantilly Ct
- 322 W Harwood Rd Unit B
- 421 Cavender Ct
- 461 Shade Tree Ct
- 440 W Louella Dr
- 2212 Mountainview Dr
- 3032 Shenandoah Dr
- 620 Highview Ln
- 617 Indian Trail
- 520 Baker Dr
- 2241 Mountainview Dr
- 200 Hillview Dr
- 524 Circleview Dr N
- 604 Baker Dr
- 1705 Louella Ct
- 3006 Wayside Dr
- 600 Circleview Dr N
- 301 Chapelwood Dr
- 321 Mountainview Dr
- 317 Mountainview Dr
- 325 Mountainview Dr
- 332 Chantilly Ct
- 336 Chantilly Ct
- 324 Chantilly Ct
- 320 Mountainview Dr
- 313 Mountainview Dr
- 329 Mountainview Dr
- 316 Mountainview Dr
- 320 Chantilly Ct
- 324 Mountainview Dr
- 340 Chantilly Ct
- 316 Chantilly Ct
- 312 Mountainview Dr
- 328 Mountainview Dr
- 309 Mountainview Dr
- 329 Chantilly Ct
- 344 Chantilly Ct
- 321 Stratford Dr
Ask me questions while you tour the home.