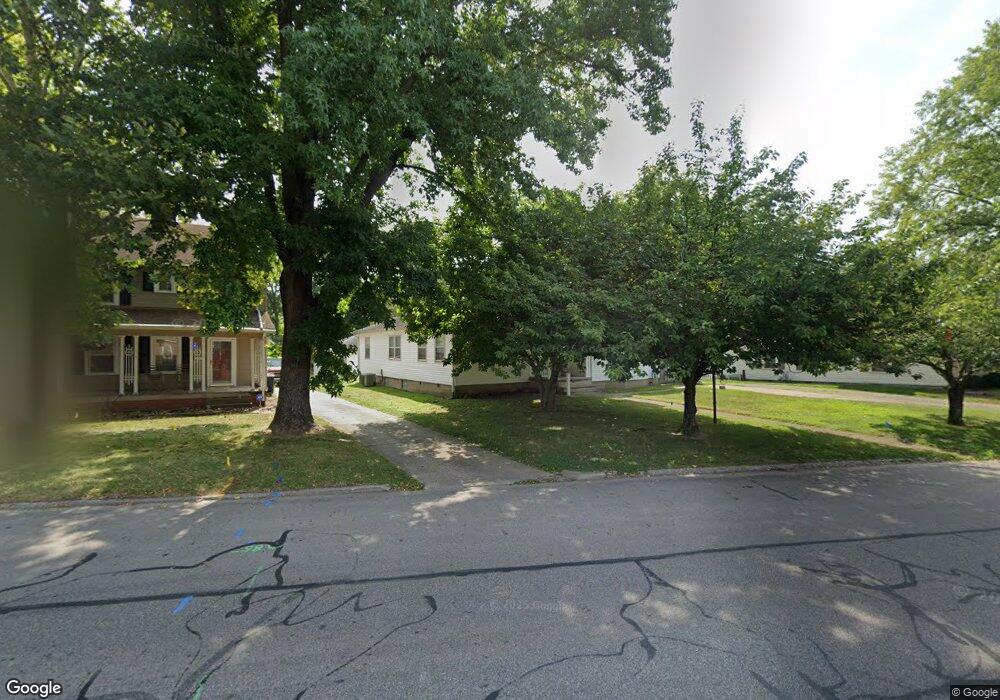
328 N Cherry St Lancaster, OH 43130
Estimated Value: $246,905 - $282,000
3
Beds
2
Baths
1,769
Sq Ft
$148/Sq Ft
Est. Value
About This Home
This home is located at 328 N Cherry St, Lancaster, OH 43130 and is currently estimated at $261,226, approximately $147 per square foot. 328 N Cherry St is a home located in Fairfield County with nearby schools including Thomas Ewing Junior High School, Lancaster High School, and St Mary Elementary School.
Ownership History
Date
Name
Owned For
Owner Type
Purchase Details
Closed on
Apr 29, 2015
Sold by
Theller Mary Anne
Bought by
Howell Chad M and Howell Kim
Current Estimated Value
Home Financials for this Owner
Home Financials are based on the most recent Mortgage that was taken out on this home.
Original Mortgage
$107,899
Outstanding Balance
$82,190
Interest Rate
3.77%
Mortgage Type
New Conventional
Estimated Equity
$179,036
Purchase Details
Closed on
Jul 1, 1988
Create a Home Valuation Report for This Property
The Home Valuation Report is an in-depth analysis detailing your home's value as well as a comparison with similar homes in the area
Home Values in the Area
Average Home Value in this Area
Purchase History
| Date | Buyer | Sale Price | Title Company |
|---|---|---|---|
| Howell Chad M | $119,900 | Valmer Land Title Agency Box | |
| -- | $60,500 | -- |
Source: Public Records
Mortgage History
| Date | Status | Borrower | Loan Amount |
|---|---|---|---|
| Open | Howell Chad M | $107,899 |
Source: Public Records
Tax History
| Year | Tax Paid | Tax Assessment Tax Assessment Total Assessment is a certain percentage of the fair market value that is determined by local assessors to be the total taxable value of land and additions on the property. | Land | Improvement |
|---|---|---|---|---|
| 2025 | $5,199 | $99,140 | $27,120 | $72,020 |
| 2024 | $5,199 | $57,830 | $12,610 | $45,220 |
| 2023 | $2,103 | $57,830 | $12,610 | $45,220 |
| 2022 | $2,112 | $57,830 | $12,610 | $45,220 |
| 2021 | $1,868 | $47,930 | $12,610 | $35,320 |
| 2020 | $1,790 | $47,930 | $12,610 | $35,320 |
| 2019 | $1,702 | $47,930 | $12,610 | $35,320 |
| 2018 | $1,458 | $39,010 | $12,610 | $26,400 |
| 2017 | $1,459 | $39,010 | $12,610 | $26,400 |
| 2016 | $1,421 | $39,010 | $12,610 | $26,400 |
| 2015 | $1,132 | $38,920 | $12,610 | $26,310 |
| 2014 | $1,079 | $38,920 | $12,610 | $26,310 |
| 2013 | $1,079 | $38,920 | $12,610 | $26,310 |
Source: Public Records
Map
Nearby Homes
- 869 E Mulberry St
- 859 E Mulberry St
- 844 E Wheeling St
- 621 Harding Ave
- 138 N Ewing St
- 612 Oakwood Ave
- 840 E Main St
- 701 Franklin Ave
- 834 E Main St
- 1115 E Walnut St
- 731 Boyd St
- 1106 E Walnut St
- 1113 E Locust St
- 1403 E Chestnut St
- 1281 E Allen St
- 810 N Eastwood Ave
- 705 Madison Ave
- 403 S Ewing St
- 610 E 5th Ave
- 647 E Walnut St
- 324 N Cherry St
- 316 N Cherry St
- 330 N Cherry St
- 312 N Cherry St
- 400 N Cherry St
- 304 N Cherry St
- 410 N Cherry St
- 333 N Cherry St
- 246 N Cherry St
- 401 N Cherry St
- 319 N Cherry St
- 317 N Cherry St
- 407 N Cherry St
- 315 N Cherry St
- 409 N Cherry St
- 420 N Cherry St
- 420 N Cherry St Unit N
- 244 N Cherry St
- 897 E Mulberry St
- 411 N Cherry St
Your Personal Tour Guide
Ask me questions while you tour the home.