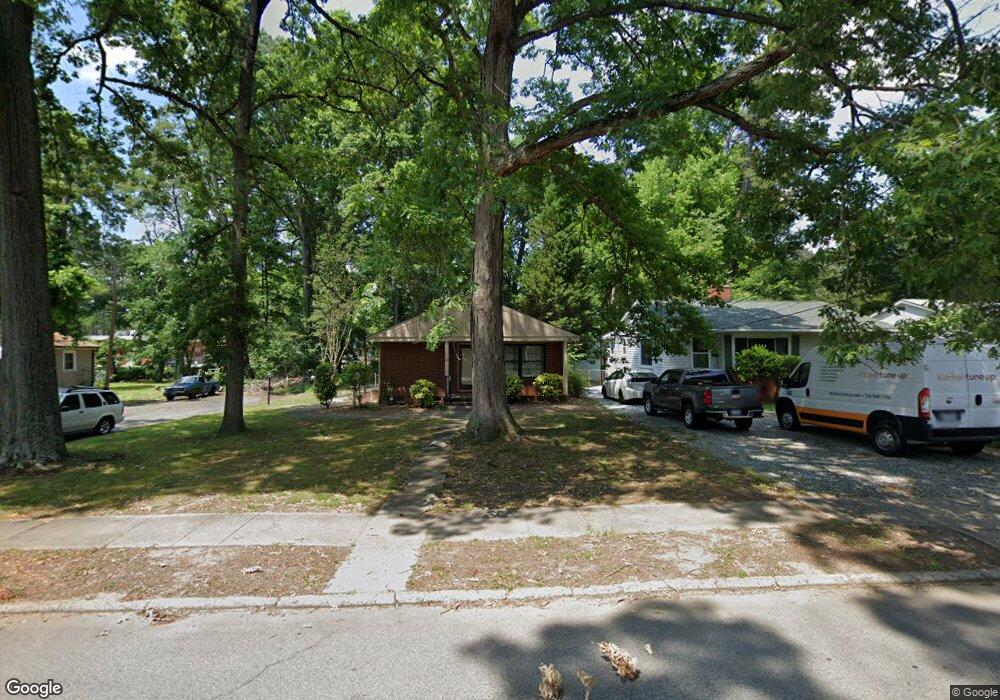
328 S Merritt Ave Salisbury, NC 28144
Estimated Value: $179,000 - $224,000
3
Beds
2
Baths
1,270
Sq Ft
$155/Sq Ft
Est. Value
About This Home
This home is located at 328 S Merritt Ave, Salisbury, NC 28144 and is currently estimated at $196,528, approximately $154 per square foot. 328 S Merritt Ave is a home located in Rowan County with nearby schools including Carroll T Overton Elementary School, North Rowan Middle School, and Salisbury High School.
Ownership History
Date
Name
Owned For
Owner Type
Purchase Details
Closed on
Jan 9, 2015
Sold by
Secretary Of Hud
Bought by
Dean Jerry Dwane
Current Estimated Value
Home Financials for this Owner
Home Financials are based on the most recent Mortgage that was taken out on this home.
Original Mortgage
$33,750
Outstanding Balance
$26,012
Interest Rate
4.01%
Mortgage Type
Farmers Home Administration
Estimated Equity
$170,516
Purchase Details
Closed on
Jun 26, 2014
Sold by
Citimortgage Inc
Bought by
Secretary Of Hud
Purchase Details
Closed on
Jun 18, 2014
Sold by
Falotico Heather
Bought by
Citimortgage Inc
Purchase Details
Closed on
Mar 28, 2008
Sold by
Casey Joseph Howard and Casey Martha H
Bought by
Falotico Heather J
Home Financials for this Owner
Home Financials are based on the most recent Mortgage that was taken out on this home.
Original Mortgage
$78,173
Interest Rate
6.22%
Mortgage Type
FHA
Create a Home Valuation Report for This Property
The Home Valuation Report is an in-depth analysis detailing your home's value as well as a comparison with similar homes in the area
Home Values in the Area
Average Home Value in this Area
Purchase History
| Date | Buyer | Sale Price | Title Company |
|---|---|---|---|
| Dean Jerry Dwane | -- | None Available | |
| Secretary Of Hud | -- | None Available | |
| Citimortgage Inc | $79,529 | None Available | |
| Falotico Heather J | $79,500 | None Available |
Source: Public Records
Mortgage History
| Date | Status | Borrower | Loan Amount |
|---|---|---|---|
| Open | Dean Jerry Dwane | $33,750 | |
| Previous Owner | Falotico Heather J | $78,173 |
Source: Public Records
Tax History
| Year | Tax Paid | Tax Assessment Tax Assessment Total Assessment is a certain percentage of the fair market value that is determined by local assessors to be the total taxable value of land and additions on the property. | Land | Improvement |
|---|---|---|---|---|
| 2025 | $1,272 | $106,388 | $17,680 | $88,708 |
| 2024 | $1,272 | $106,388 | $17,680 | $88,708 |
| 2023 | $1,272 | $106,388 | $17,680 | $88,708 |
| 2022 | $989 | $71,841 | $14,560 | $57,281 |
| 2021 | $989 | $71,841 | $14,560 | $57,281 |
| 2020 | $989 | $71,841 | $14,560 | $57,281 |
| 2019 | $989 | $71,841 | $14,560 | $57,281 |
| 2018 | $821 | $60,458 | $14,560 | $45,898 |
| 2017 | $817 | $60,458 | $14,560 | $45,898 |
| 2016 | $795 | $60,458 | $14,560 | $45,898 |
| 2015 | $800 | $60,458 | $14,560 | $45,898 |
| 2014 | $883 | $67,585 | $13,520 | $54,065 |
Source: Public Records
Map
Nearby Homes
- 308 S Merritt Ave
- 301 S Merritt Ave
- 1304 Brenner Ave
- 127 Lilly Ave
- 1534 W Horah St
- 225 Valleyview Place
- 400 Statesville Blvd
- 151 E Corriher Ave
- 411 Grim St
- 1102 W Horah St
- 1219 Old Wilkesboro Rd
- 00 W Horah St
- 1300 Larchmont Place Unit 810
- 1300 Larchmont Place Unit 901
- 1300 Larchmont Place Unit 311
- 725 Mocksville Ave
- 730 W Innes St
- 827 W Horah St
- 1728 Colony Rd
- 0 Old Mocksville Rd Unit CAR4366537
- 324 S Merritt Ave
- 400 S Merritt Ave
- 320 S Merritt Ave
- 404 S Merritt Ave
- 312 S Merritt Ave
- 225 S Link Ave
- 412 S Merritt Ave
- 301 S Link Ave
- 325 S Merritt Ave
- 321 S Merritt Ave
- 401 S Merritt Ave
- 317 S Merritt Ave
- 211 S Link Ave
- 405 S Merritt Ave
- 313 S Merritt Ave
- 414 S Merritt Ave
- 302 S Merritt Ave
- 409 S Merritt Ave
- 307 S Merritt Ave
- 205 S Link Ave
Your Personal Tour Guide
Ask me questions while you tour the home.