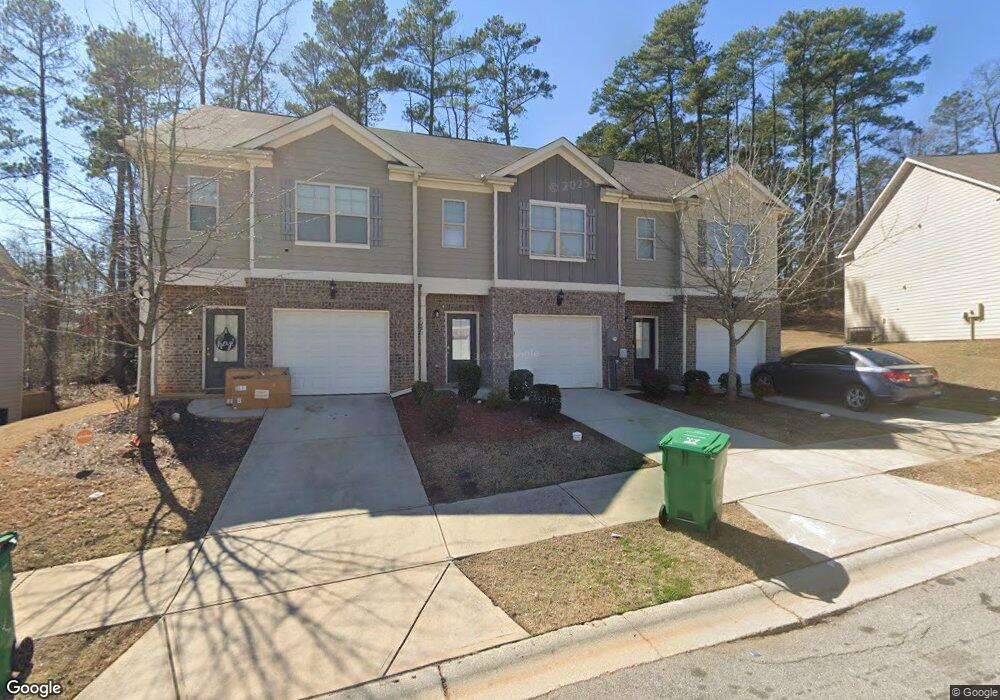
3281 Pennington Dr Lithonia, GA 30038
Estimated Value: $197,000 - $220,000
About This Home
Please note, our homes are available on a first-come, first-serve basis and are not reserved until the lease is signed by all applicants and security deposits are collected.
This home features Progress Smart Home - Progress Residential's smart home app, which allows you to control the home securely from any of your devices. Learn more at
Rent this home by November 16, 2025 and receive $500.
Want to tour on your own? Click the “Self Tour” button on this home’s listing or call to register for a self-guided showing at a time that works best for you.
Interested in this home? You clearly have exceptional taste. This charming 3-bedroom, 2.5-bathroom home is not only pet-friendly, but also equipped with smart home features to make everyday life more convenient and connected. Homes like this don’t stay on the market for long—don’t miss your chance to make it yours. Apply today!
Ownership History
Purchase Details
Purchase Details
Purchase Details
Purchase Details
Home Values in the Area
Average Home Value in this Area
Purchase History
| Date | Buyer | Sale Price | Title Company |
|---|---|---|---|
| Progress Residential Borrower 25 Llc | -- | -- | |
| Sfr Investments V Borrower 1 Llc | $1,977,519 | -- | |
| Atl 3 Sf Llc | $1,331,125 | -- | |
| Brs Better Neighborhoods Inc | $150,000 | -- | |
| Mckinley Homes Us Llc | -- | -- |
Property History
| Date | Event | Price | List to Sale | Price per Sq Ft |
|---|---|---|---|---|
| 11/12/2025 11/12/25 | Off Market | $1,715 | -- | -- |
| 11/07/2025 11/07/25 | Price Changed | $1,715 | +1.8% | $1 / Sq Ft |
| 11/06/2025 11/06/25 | Price Changed | $1,685 | +0.3% | $1 / Sq Ft |
| 10/27/2025 10/27/25 | Price Changed | $1,680 | -0.9% | $1 / Sq Ft |
| 10/23/2025 10/23/25 | Price Changed | $1,695 | -2.0% | $1 / Sq Ft |
| 10/19/2025 10/19/25 | Price Changed | $1,730 | +1.8% | $1 / Sq Ft |
| 10/18/2025 10/18/25 | Price Changed | $1,700 | +1.5% | $1 / Sq Ft |
| 10/15/2025 10/15/25 | Price Changed | $1,675 | -0.6% | $1 / Sq Ft |
| 10/14/2025 10/14/25 | Price Changed | $1,685 | -2.9% | $1 / Sq Ft |
| 10/09/2025 10/09/25 | Price Changed | $1,735 | -0.9% | $1 / Sq Ft |
| 10/08/2025 10/08/25 | Price Changed | $1,750 | -1.1% | $1 / Sq Ft |
| 10/05/2025 10/05/25 | Price Changed | $1,770 | -1.7% | $1 / Sq Ft |
| 10/04/2025 10/04/25 | Price Changed | $1,800 | -2.2% | $1 / Sq Ft |
| 09/27/2025 09/27/25 | Price Changed | $1,840 | -1.9% | $1 / Sq Ft |
| 09/23/2025 09/23/25 | Price Changed | $1,875 | -0.3% | $1 / Sq Ft |
| 09/19/2025 09/19/25 | Price Changed | $1,880 | +0.3% | $1 / Sq Ft |
| 09/13/2025 09/13/25 | Price Changed | $1,875 | +0.3% | $1 / Sq Ft |
| 09/07/2025 09/07/25 | Price Changed | $1,870 | +0.3% | $1 / Sq Ft |
| 09/05/2025 09/05/25 | Price Changed | $1,865 | +0.3% | $1 / Sq Ft |
| 09/03/2025 09/03/25 | Price Changed | $1,860 | +0.3% | $1 / Sq Ft |
| 08/31/2025 08/31/25 | Price Changed | $1,855 | +0.3% | $1 / Sq Ft |
| 08/29/2025 08/29/25 | Price Changed | $1,850 | +0.3% | $1 / Sq Ft |
| 08/29/2025 08/29/25 | Price Changed | $1,845 | +0.3% | $1 / Sq Ft |
| 08/26/2025 08/26/25 | Price Changed | $1,840 | +0.3% | $1 / Sq Ft |
| 08/23/2025 08/23/25 | Price Changed | $1,835 | +0.3% | $1 / Sq Ft |
| 08/21/2025 08/21/25 | Price Changed | $1,830 | +0.3% | $1 / Sq Ft |
| 08/16/2025 08/16/25 | Price Changed | $1,825 | +0.3% | $1 / Sq Ft |
| 08/15/2025 08/15/25 | Price Changed | $1,820 | +0.3% | $1 / Sq Ft |
| 08/15/2025 08/15/25 | Price Changed | $1,815 | +1.7% | $1 / Sq Ft |
| 08/09/2025 08/09/25 | Price Changed | $1,785 | +0.3% | $1 / Sq Ft |
| 08/08/2025 08/08/25 | Price Changed | $1,780 | -0.6% | $1 / Sq Ft |
| 08/06/2025 08/06/25 | Price Changed | $1,790 | +1.1% | $1 / Sq Ft |
| 08/01/2025 08/01/25 | For Rent | $1,770 | -- | -- |
Map
- 3015 Bonnes Dr
- 5843 Taka Ln
- 5924 Cassie Dr
- 5873 Taka Ln
- 3095 Bonnes Dr
- 3251 Hunters Crossing Point
- 5619 Regency Forest Ct Unit 2
- 5544 Alpine Ct
- 3102 Aberdeen Cove Unit III
- 5796 Par Four Ct
- 5566 La Fleur Trail
- 5820 Par Four Ct
- 4103 Fairington Club Dr
- 4101 Fairington Club Dr
- 3237 Fairington Dr
- 3229 Fairington Dr Unit 3229
- 5780 Par Four Ct
- 5303 Fairington Club Dr
- 3221 Fairington Dr
- 5301 Fairington Club Dr
- 3281 Pennington Dr
- 3281 Pennington Dr Unit 240
- 3283 Pennington Dr Unit 241
- 3283 Pennington Dr
- 3279 Pennington Dr
- 3279 Pennington Dr Unit 241
- 3279 Pennington Dr
- 3285 Pennington Dr
- 3275 Pennington Dr
- 3289 Pennington Dr
- 3273 Pennington Dr
- 2080 Bonnes Dr
- 3276 Pennington Dr Unit 273
- 3291 Pennington Dr Unit 241
- 3280 Pennington Dr
- 3274 Pennington Dr
- 3286 Pennington Dr
- 3269 Pennington Dr
- 3288 Pennington Dr
- 3267 Pennington Dr
Ask me questions while you tour the home.