329 Cross St Hanson, MA 02341
Estimated Value: $588,000 - $662,000
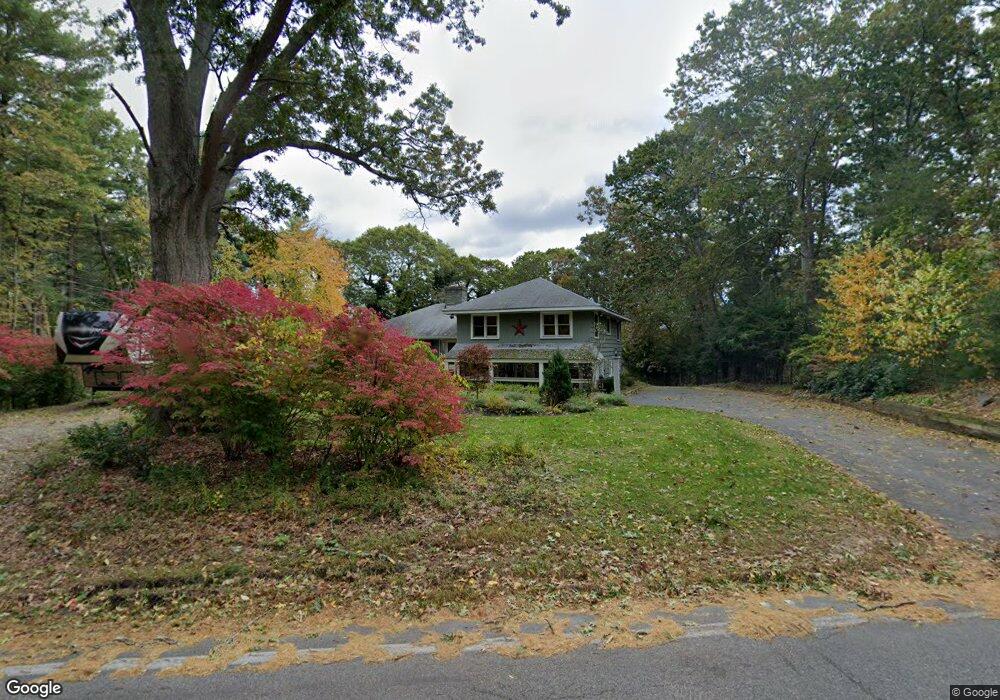
About This Home
This home is located at 329 Cross St, Hanson, MA 02341 and is currently estimated at $624,034, approximately $303 per square foot. 329 Cross St is a home located in Plymouth County with nearby schools including Cardinal Cushing Centers.
Ownership History
We collect this data history from publicly available records. To have your information removed, we recommend requesting removal directly through your county’s website.
Purchase Details
Purchase Details
Home Financials for this Owner
Home Financials are based on the most recent Mortgage that was taken out on this home.Purchase Details
Home Values in the Area
Average Home Value in this Area
Purchase History
We collect this data history from publicly available records. To have your information removed, we recommend requesting removal directly through your county’s website.
| Date | Buyer | Sale Price | Title Company |
|---|---|---|---|
| -- | None Available | ||
| -- | None Available | ||
| $305,000 | -- | ||
| $305,000 | -- | ||
| -- | -- | ||
| -- | -- |
Mortgage History
We collect this data history from publicly available records. To have your information removed, we recommend requesting removal directly through your county’s website.
| Date | Status | Borrower | Loan Amount |
|---|---|---|---|
| Previous Owner | $274,500 | ||
| Previous Owner | $274,500 |
Tax History
We collect this data history from publicly available records. To have your information removed, we recommend requesting removal directly through your county’s website.
| Year | Tax Paid | Tax Assessment Tax Assessment Total Assessment is a certain percentage of the fair market value that is determined by local assessors to be the total taxable value of land and additions on the property. | Land | Improvement |
|---|---|---|---|---|
| 2025 | $7,347 | $549,100 | $181,200 | $367,900 |
| 2024 | $7,137 | $533,400 | $176,000 | $357,400 |
| 2023 | $6,916 | $487,700 | $176,000 | $311,700 |
| 2022 | $6,694 | $443,600 | $160,000 | $283,600 |
| 2021 | $6,102 | $404,100 | $153,800 | $250,300 |
| 2020 | $5,966 | $390,700 | $148,600 | $242,100 |
| 2019 | $5,428 | $349,500 | $145,700 | $203,800 |
| 2018 | $5,324 | $336,300 | $140,100 | $196,200 |
| 2017 | $5,171 | $323,600 | $133,500 | $190,100 |
| 2016 | $5,268 | $318,300 | $133,500 | $184,800 |
| 2015 | $4,959 | $311,500 | $133,500 | $178,000 |
Map
- 243 Maquan St
- 254 Lakeside Rd
- 113 Andrew Ln
- 42 Taylor Point Rd
- 161 Winter St Unit 2
- 102 Ransom Rd
- 63 Pine Tree Ln
- 258 State St
- 241 Indian Head St
- Lot 6 Way
- Lot 2 Harvard Rd
- 7 Elm Place
- 56 Wildwood Rd
- 700 High St
- 77 Furnace Ln
- 90 W Elm St
- 58 Carriage Rd
- 361A County Rd
- Lot 5 Princeton Way
- 29 Andrew Dr
- 345 Cross St
- 354 Cross St
- 332 Cross St
- 72 Lakeside Terrace
- 66 Lakeside Terrace
- 311 Cross St
- 328 Cross St
- 54 Lakeside Terrace
- 377 Cross St
- 89 Crescent Place
- 0 Lakeside Unit 70852507
- 0 Lakeside Unit 73010458
- 0 Lakeside Unit 70665697
- 71 Crescent Place
- 388 Cross St
- 299 Cross St
- 11 Crescent Place
- 103 Crescent Place
- 119 Crescent Place
- 202 Lakeside Rd
Ask me questions while you tour the home.