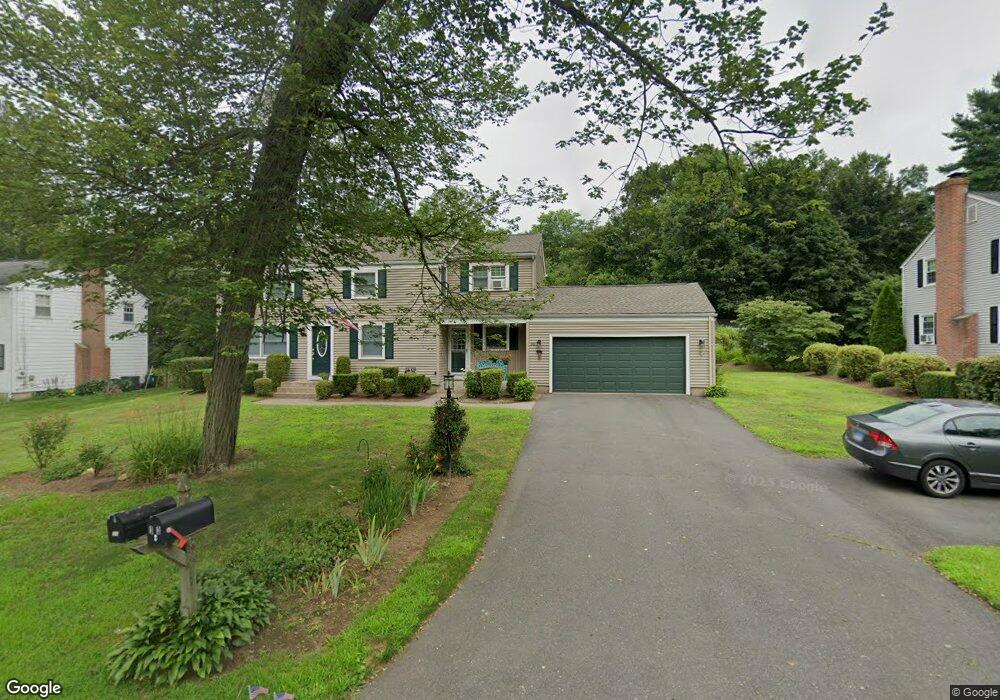
33 Alder Rd Simsbury, CT 06070
Estimated Value: $517,000 - $619,000
4
Beds
4
Baths
2,176
Sq Ft
$257/Sq Ft
Est. Value
About This Home
This home is located at 33 Alder Rd, Simsbury, CT 06070 and is currently estimated at $558,482, approximately $256 per square foot. 33 Alder Rd is a home located in Hartford County with nearby schools including Squadron Line School, Henry James Memorial School, and Simsbury High School.
Ownership History
Date
Name
Owned For
Owner Type
Purchase Details
Closed on
Feb 2, 1998
Sold by
Foster J Kevin and Foster Susan
Bought by
Salina Thomas and Salina Susan
Current Estimated Value
Home Financials for this Owner
Home Financials are based on the most recent Mortgage that was taken out on this home.
Original Mortgage
$146,500
Interest Rate
7.02%
Mortgage Type
Unknown
Create a Home Valuation Report for This Property
The Home Valuation Report is an in-depth analysis detailing your home's value as well as a comparison with similar homes in the area
Home Values in the Area
Average Home Value in this Area
Purchase History
| Date | Buyer | Sale Price | Title Company |
|---|---|---|---|
| Salina Thomas | $191,500 | -- |
Source: Public Records
Mortgage History
| Date | Status | Borrower | Loan Amount |
|---|---|---|---|
| Open | Salina Thomas | $165,500 | |
| Closed | Salina Thomas | $130,950 | |
| Closed | Salina Thomas | $175,000 | |
| Closed | Salina Thomas | $146,500 |
Source: Public Records
Tax History
| Year | Tax Paid | Tax Assessment Tax Assessment Total Assessment is a certain percentage of the fair market value that is determined by local assessors to be the total taxable value of land and additions on the property. | Land | Improvement |
|---|---|---|---|---|
| 2025 | $8,532 | $249,760 | $74,900 | $174,860 |
| 2024 | $8,320 | $249,760 | $74,900 | $174,860 |
| 2023 | $7,947 | $249,760 | $74,900 | $174,860 |
| 2022 | $7,271 | $188,230 | $79,410 | $108,820 |
| 2021 | $7,271 | $188,230 | $79,410 | $108,820 |
| 2020 | $6,981 | $188,230 | $79,410 | $108,820 |
| 2019 | $7,025 | $188,230 | $79,410 | $108,820 |
| 2018 | $7,076 | $188,230 | $79,410 | $108,820 |
| 2017 | $6,768 | $174,620 | $79,410 | $95,210 |
| 2016 | $6,482 | $174,620 | $79,410 | $95,210 |
| 2015 | $6,482 | $174,620 | $79,410 | $95,210 |
| 2014 | $6,485 | $174,620 | $79,410 | $95,210 |
Source: Public Records
Map
Nearby Homes
- 92 Laurel Ln
- 7 Grimes Brook Place
- 16 Richard Rd
- 36 Clifdon Dr
- 14 Richard Rd
- 121 Hoskins Rd
- 7 School House Ln
- 14 North Dr
- 28 Great Pond Rd
- 10 Litchfield Dr
- 5 Sanctuary Dr
- 31 Oxford Ct
- 89 Hop Brook Rd
- 79 Cambridge Ct
- 3 Lenora Dr
- 59 Cambridge Ct
- 6 Heritage Ln
- 100 Cambridge Ct
- 324 Old Farms Rd
- 9 Carriage Dr Unit 9
Your Personal Tour Guide
Ask me questions while you tour the home.