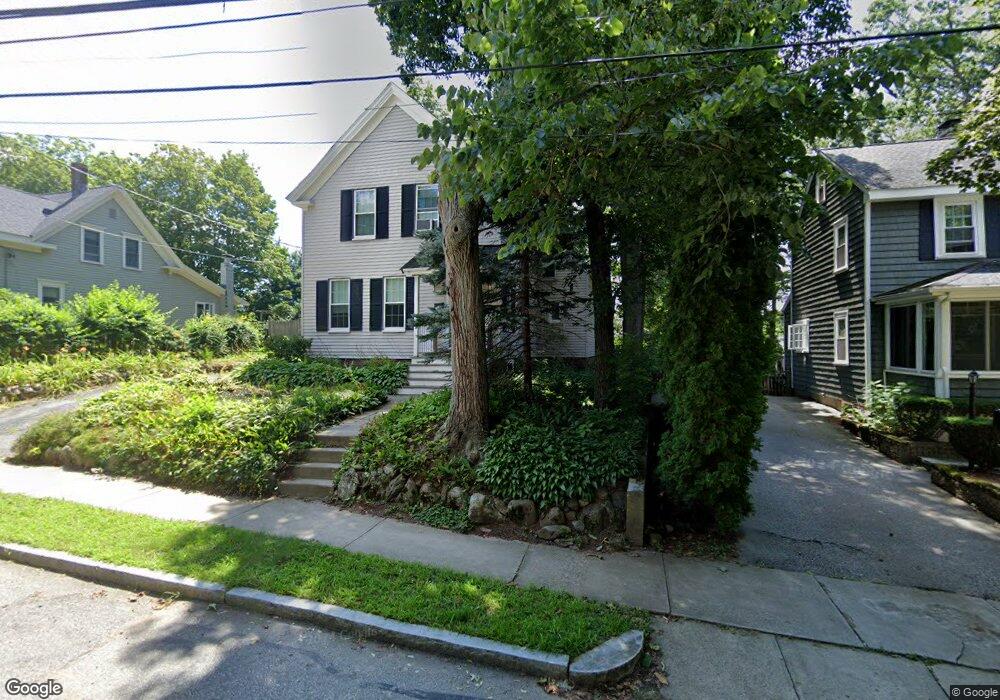
33 Auburn St Reading, MA 01867
Estimated Value: $679,000 - $713,000
3
Beds
1
Bath
1,328
Sq Ft
$526/Sq Ft
Est. Value
About This Home
This home is located at 33 Auburn St, Reading, MA 01867 and is currently estimated at $698,113, approximately $525 per square foot. 33 Auburn St is a home located in Middlesex County with nearby schools including Birch Meadow Elementary School, Arthur W. Coolidge Middle School, and Reading Memorial High School.
Ownership History
Date
Name
Owned For
Owner Type
Purchase Details
Closed on
Mar 18, 2021
Sold by
Thabet Khaireddin S and Thabet Sheila C
Bought by
Thabet Sheila C
Current Estimated Value
Home Financials for this Owner
Home Financials are based on the most recent Mortgage that was taken out on this home.
Original Mortgage
$225,000
Outstanding Balance
$199,761
Interest Rate
2.8%
Mortgage Type
New Conventional
Estimated Equity
$498,352
Purchase Details
Closed on
May 31, 2002
Sold by
Mitchell Mary L
Bought by
Thabet Khaireddin S and Thabet Sheila Clegg
Home Financials for this Owner
Home Financials are based on the most recent Mortgage that was taken out on this home.
Original Mortgage
$256,500
Interest Rate
7%
Mortgage Type
Purchase Money Mortgage
Create a Home Valuation Report for This Property
The Home Valuation Report is an in-depth analysis detailing your home's value as well as a comparison with similar homes in the area
Home Values in the Area
Average Home Value in this Area
Purchase History
| Date | Buyer | Sale Price | Title Company |
|---|---|---|---|
| Thabet Sheila C | -- | None Available | |
| Thabet Khaireddin S | $293,500 | -- | |
| Thabet Khaireddin S | $293,500 | -- |
Source: Public Records
Mortgage History
| Date | Status | Borrower | Loan Amount |
|---|---|---|---|
| Open | Thabet Sheila C | $225,000 | |
| Previous Owner | Thabet Khaireddin S | $256,500 |
Source: Public Records
Tax History
| Year | Tax Paid | Tax Assessment Tax Assessment Total Assessment is a certain percentage of the fair market value that is determined by local assessors to be the total taxable value of land and additions on the property. | Land | Improvement |
|---|---|---|---|---|
| 2025 | $7,189 | $631,200 | $434,000 | $197,200 |
| 2024 | $7,272 | $620,500 | $426,600 | $193,900 |
| 2023 | $7,361 | $584,700 | $402,000 | $182,700 |
| 2022 | $7,133 | $535,100 | $367,800 | $167,300 |
| 2021 | $6,665 | $482,600 | $317,200 | $165,400 |
| 2020 | $6,515 | $467,000 | $306,900 | $160,100 |
| 2019 | $6,231 | $437,900 | $287,700 | $150,200 |
| 2018 | $5,782 | $416,900 | $273,900 | $143,000 |
| 2017 | $5,463 | $389,400 | $255,800 | $133,600 |
| 2016 | $5,369 | $370,300 | $256,700 | $113,600 |
| 2015 | $5,183 | $352,600 | $244,400 | $108,200 |
| 2014 | $4,835 | $328,000 | $227,300 | $100,700 |
Source: Public Records
Map
Nearby Homes
- 863 Main St
- 35 Longfellow Rd
- 52 Sanborn St Unit 7
- 64 Longfellow Rd
- 89 Grand St
- 69 Ash St
- 5 Washington St Unit D4
- 48 Village St Unit 1001
- 103 Orange St
- 41 Winter St
- 24 Smith Ave
- 115 Forest St
- 100 Prescott St
- 3 Carnation Cir Unit C
- 237 Salem St Unit 2
- 34 Plymouth Rd
- 43 Ashley Place
- 101 King St Unit 101
- 45 Longview Rd
- 37 Fremont St
Your Personal Tour Guide
Ask me questions while you tour the home.