
Seller's Agent in 2025
Luis Poblete
Samson Properties
(703) 296-6701
1 in this area
21 Total Sales


Estimated Value: $120,000 - $139,142
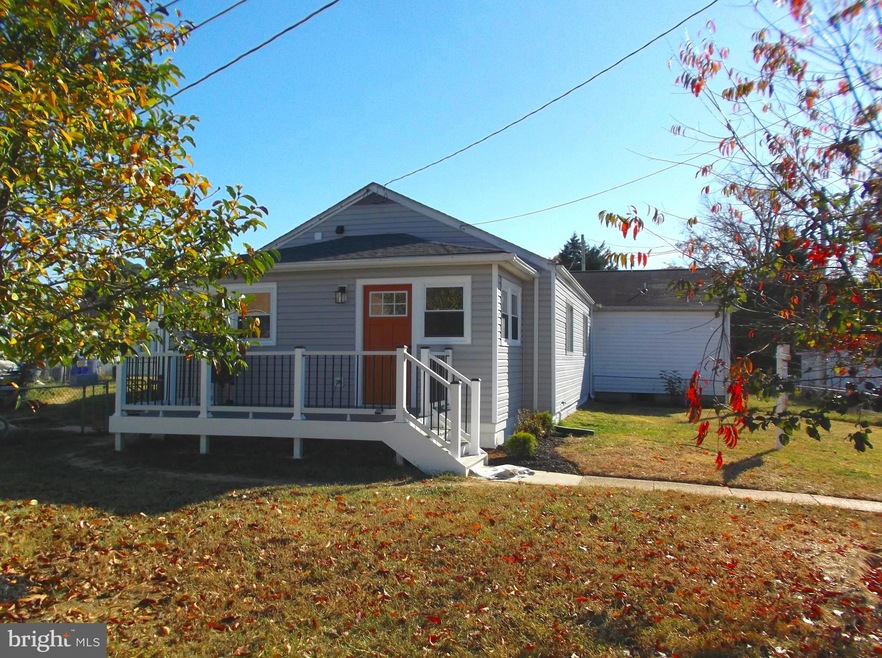
Welcome to this charming and renovated duplex in the Potomac Heights Cooperative Community, this home features 2 Bedrooms, 2 Full & 1 Dem, Upgrades and improvements including updated and reconfigured kitchen with granite countertops, quality cabinets and newer appliances. Hardwood floor, all bathrooms are renovated and updated. New Roof, newer windows and doors, new HVAC, Water Heater as well as washer and dryer. The laminated finished floor is a luxury waterproof, Enjoy the amenities of the Coop community pool, tot lot, and lawn maintenance! It's the perfect home in a fantastic location.
This is a cooperative community, and Buyers must pick up a Buyer Packet from the housing office, all information needed to purchase is in the packet. Prospects Buyer(s) must be approved for membership by Coop Board (Coop review process could take 1-2 weeks), but we will review any offer as is received. No renting or investor are allowed.
Last Agent to Sell the Property
(703) 378-8810 donnysamson@samsonproperties.net Samson Properties Listed on: 11/18/2024
| Date | Event | Price | List to Sale | Price per Sq Ft | Prior Sale |
|---|---|---|---|---|---|
| 01/06/2025 01/06/25 | Sold | $150,000 | -6.0% | $166 / Sq Ft | |
| 11/18/2024 11/18/24 | For Sale | $159,500 | +325.3% | $176 / Sq Ft | |
| 11/27/2023 11/27/23 | Sold | $37,500 | -31.8% | $41 / Sq Ft | View Prior Sale |
| 10/28/2023 10/28/23 | For Sale | $55,000 | 0.0% | $61 / Sq Ft | |
| 06/02/2023 06/02/23 | Pending | -- | -- | -- | |
| 04/19/2023 04/19/23 | Price Changed | $55,000 | -15.4% | $61 / Sq Ft | |
| 03/27/2023 03/27/23 | For Sale | $65,000 | -- | $72 / Sq Ft |
| Year | Tax Paid | Tax Assessment Tax Assessment Total Assessment is a certain percentage of the fair market value that is determined by local assessors to be the total taxable value of land and additions on the property. | Land | Improvement |
|---|---|---|---|---|
| 2025 | -- | $69,400 | $35,000 | $34,400 |
| 2024 | $1,157 | $63,433 | $0 | $0 |
| 2023 | $821 | $57,467 | $0 | $0 |
| 2022 | $945 | $51,500 | $25,000 | $26,500 |
| 2020 | $1,789 | $51,500 | $25,000 | $26,500 |
| 2019 | $1,039 | $63,700 | $25,000 | $38,700 |
| 2018 | $787 | $59,733 | $0 | $0 |
| 2017 | $821 | $55,767 | $0 | $0 |
| 2016 | -- | $51,800 | $0 | $0 |
| 2015 | $1,121 | $51,800 | $0 | $0 |
| 2014 | $1,121 | $51,800 | $0 | $0 |
Seller's Agent in 2025
Luis Poblete
Samson Properties
(703) 296-6701
1 in this area
21 Total Sales
Buyer's Agent in 2025
LaShonda Weaver
HomeSmart
(240) 466-2177
2 in this area
9 Total Sales
Seller's Agent in 2023
Jeanette Hines Taylor
Vylla Home
(240) 604-6442
1 in this area
20 Total Sales
d
Buyer's Agent in 2023
datacorrect BrightMLS
Non Subscribing Office
Source: Bright MLS
MLS Number: MDCH2037452
APN: 07-068271
Disclaimer: Certain information contained herein is derived from information provided by parties other than Homes.com. All information provided is deemed reliable, but is not guaranteed to be accurate and should be independently verified.
![]() The data relating to real estate for sale on this website appears in part through the BRIGHT Internet Data Exchange program, a voluntary cooperative exchange of property listing data between licensed real estate brokerage firms, and is provided by BRIGHT through a licensing agreement.
The data relating to real estate for sale on this website appears in part through the BRIGHT Internet Data Exchange program, a voluntary cooperative exchange of property listing data between licensed real estate brokerage firms, and is provided by BRIGHT through a licensing agreement.
Listing information is from various brokers who participate in the Bright MLS IDX program and not all listings may be visible on the site.
The property information being provided on or through the website is for the personal, non-commercial use of consumers and such information may not be used for any purpose other than to identify prospective properties consumers may be interested in purchasing.
Some properties which appear for sale on the website may no longer be available because they are for instance, under contract, sold or are no longer being offered for sale.
Property information displayed is deemed reliable but is not guaranteed.
Copyright 2026 Bright MLS, Inc.
Ask me questions while you tour the home.