33 Harding Rd Melrose, MA 02176
Melrose East Side NeighborhoodEstimated Value: $1,213,942 - $1,422,000
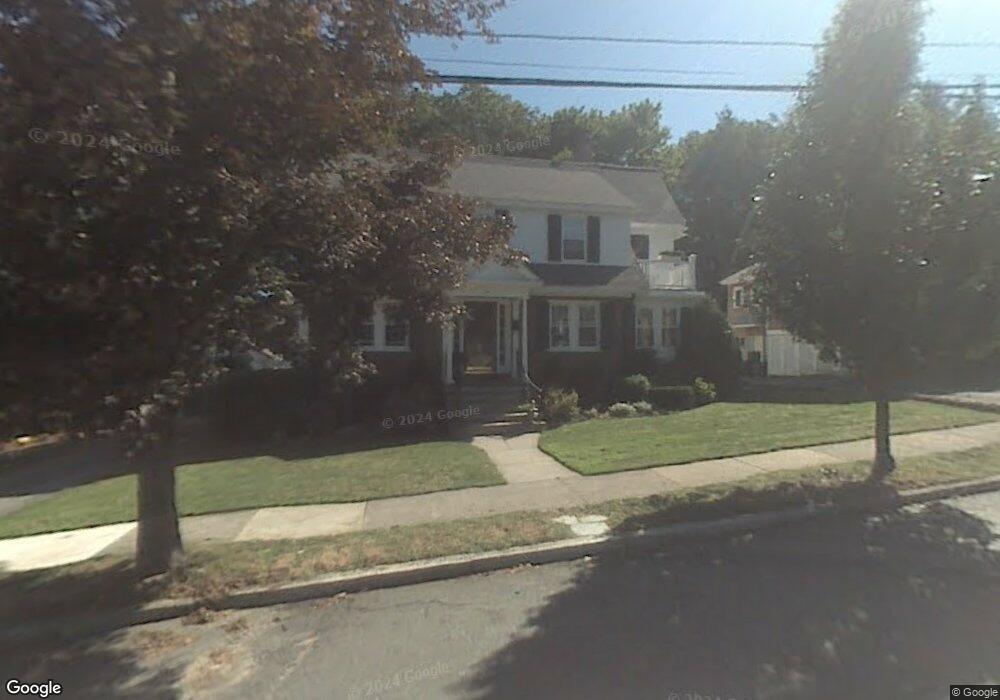
About This Home
This home is located at 33 Harding Rd, Melrose, MA 02176 and is currently estimated at $1,319,486, approximately $494 per square foot. 33 Harding Rd is a home located in Middlesex County with nearby schools including Horace Mann Elementary School, Winthrop Elementary School, and Roosevelt Elementary School.
Ownership History
We collect this data history from publicly available records. To have your information removed, we recommend requesting removal directly through your county’s website.
Purchase Details
Purchase Details
Purchase Details
Purchase Details
Home Values in the Area
Average Home Value in this Area
Purchase History
We collect this data history from publicly available records. To have your information removed, we recommend requesting removal directly through your county’s website.
| Date | Buyer | Sale Price | Title Company |
|---|---|---|---|
| -- | -- | ||
| -- | -- | ||
| -- | -- | ||
| $231,000 | -- | ||
| $231,000 | -- | ||
| $285,000 | -- |
Mortgage History
We collect this data history from publicly available records. To have your information removed, we recommend requesting removal directly through your county’s website.
| Date | Status | Borrower | Loan Amount |
|---|---|---|---|
| Previous Owner | $417,000 | ||
| Previous Owner | $417,000 |
Tax History
We collect this data history from publicly available records. To have your information removed, we recommend requesting removal directly through your county’s website.
| Year | Tax Paid | Tax Assessment Tax Assessment Total Assessment is a certain percentage of the fair market value that is determined by local assessors to be the total taxable value of land and additions on the property. | Land | Improvement |
|---|---|---|---|---|
| 2025 | $93 | $938,000 | $516,200 | $421,800 |
| 2024 | $9,314 | $938,000 | $516,200 | $421,800 |
| 2023 | $8,778 | $842,400 | $460,400 | $382,000 |
| 2022 | $8,477 | $802,000 | $432,500 | $369,500 |
| 2021 | $7,958 | $726,800 | $390,700 | $336,100 |
| 2020 | $8,032 | $726,900 | $390,700 | $336,200 |
| 2019 | $7,180 | $664,200 | $353,000 | $311,200 |
| 2018 | $7,162 | $632,100 | $320,900 | $311,200 |
| 2017 | $7,048 | $597,300 | $307,000 | $290,300 |
| 2016 | $7,521 | $610,000 | $293,000 | $317,000 |
| 2015 | $7,088 | $546,900 | $279,000 | $267,900 |
| 2014 | $7,078 | $533,000 | $265,100 | $267,900 |
Map
- 639 Lynn Fells Pkwy
- 9 Elm St
- 646 Lynn Fells Pkwy
- 60 Linden Rd
- 62 Elm St
- 127 Larchmont Rd
- 161 Green St
- 8 Linden Rd Unit 1
- 8 Linden Rd
- 228 Upham St
- 180 Green St Unit 101
- 8 Crystal St Unit 2
- 8 Crystal St Unit 3
- 29 East St
- 760 Lynn Fells Pkwy
- 57 Glendale Ave
- 49 Melrose St Unit 4B
- 51 Melrose St Unit 2D
- 51 Melrose St Unit 1A
- 51 Gooch St
Ask me questions while you tour the home.