33 Harvey Ave Riverside, RI 02915
Riverside NeighborhoodEstimated Value: $430,000 - $559,000
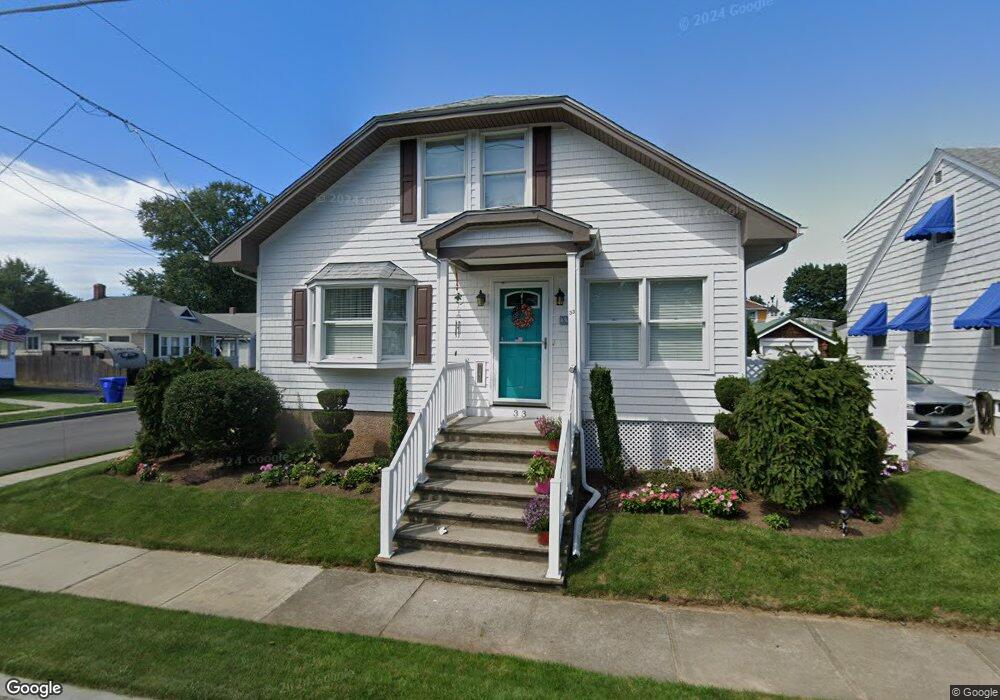
About This Home
This home is located at 33 Harvey Ave, Riverside, RI 02915 and is currently estimated at $488,044, approximately $189 per square foot. 33 Harvey Ave is a home located in Providence County with nearby schools including East Providence High School, St Mary Academy-Bay View, and St Luke Elementary School.
Ownership History
We collect this data history from publicly available records. To have your information removed, we recommend requesting removal directly through your county’s website.
Purchase Details
Home Values in the Area
Average Home Value in this Area
Purchase History
We collect this data history from publicly available records. To have your information removed, we recommend requesting removal directly through your county’s website.
| Date | Buyer | Sale Price | Title Company |
|---|---|---|---|
| -- | -- | ||
| -- | -- |
Mortgage History
We collect this data history from publicly available records. To have your information removed, we recommend requesting removal directly through your county’s website.
| Date | Status | Borrower | Loan Amount |
|---|---|---|---|
| Previous Owner | $112,000 | ||
| Previous Owner | $30,000 | ||
| Previous Owner | $53,439 |
Tax History
We collect this data history from publicly available records. To have your information removed, we recommend requesting removal directly through your county’s website.
| Year | Tax Paid | Tax Assessment Tax Assessment Total Assessment is a certain percentage of the fair market value that is determined by local assessors to be the total taxable value of land and additions on the property. | Land | Improvement |
|---|---|---|---|---|
| 2025 | $5,619 | $429,900 | $118,400 | $311,500 |
| 2024 | $6,025 | $393,000 | $98,700 | $294,300 |
| 2023 | $5,801 | $393,000 | $98,700 | $294,300 |
| 2022 | $6,095 | $278,800 | $56,500 | $222,300 |
| 2021 | $5,994 | $278,800 | $53,900 | $224,900 |
| 2020 | $5,740 | $278,800 | $53,900 | $224,900 |
| 2019 | $5,582 | $278,800 | $53,900 | $224,900 |
| 2018 | $5,482 | $239,600 | $52,400 | $187,200 |
| 2017 | $5,360 | $239,600 | $52,400 | $187,200 |
| 2016 | $5,333 | $239,600 | $52,400 | $187,200 |
| 2015 | $5,072 | $221,000 | $48,500 | $172,500 |
| 2014 | $5,072 | $221,000 | $48,500 | $172,500 |
Map
- 6 Woodbine St
- 14 Primrose Dr
- 80 Circuit Dr
- 75 Thurston St
- 73 Lindy Ave
- 22 Yale Ave
- 72 Allen Ave
- 49 Arnold St
- 115 Thurston St
- 119 Rounds Ave Unit 121
- 26 Peach Orchard Dr
- 82 Leroy Dr
- 27 Hoppin Ave
- 25 Hoppin Ave
- 79 Sherman St
- 17 Padelford Ave
- 59 Booth Ave
- 65 Ferncrest Dr
- 104 Stanton Ave
- 50 Washington Ave
Ask me questions while you tour the home.