33 High St Stoneham, MA 02180
Bear Hill NeighborhoodEstimated Value: $1,145,000 - $1,478,000
About This Home
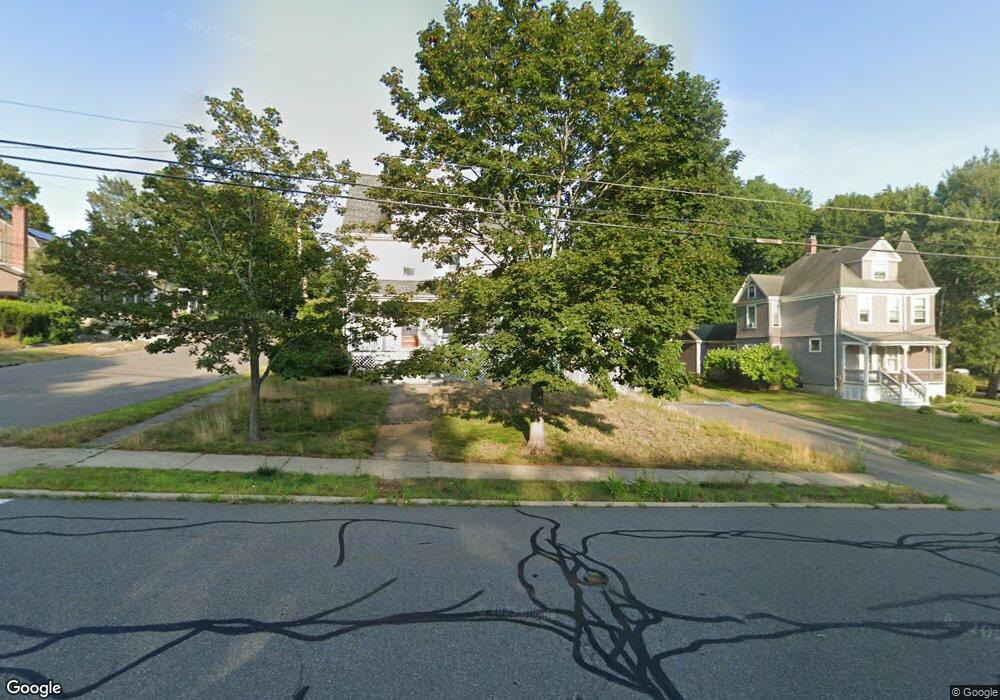
This home is located at 33 High St, Stoneham, MA 02180 and is currently estimated at $1,238,700, approximately $514 per square foot. 33 High St is a home located in Middlesex County with nearby schools including Stoneham High School, St. Patrick Elementary School, and St Joseph School.
Ownership History
We collect this data history from publicly available records. To have your information removed, we recommend requesting removal directly through your county’s website.
Purchase Details
Purchase Details
Home Financials for this Owner
Home Financials are based on the most recent Mortgage that was taken out on this home.Home Values in the Area
Average Home Value in this Area
Purchase History
We collect this data history from publicly available records. To have your information removed, we recommend requesting removal directly through your county’s website.
| Date | Buyer | Sale Price | Title Company |
|---|---|---|---|
| $876,015 | -- | ||
| $689,000 | -- |
Mortgage History
We collect this data history from publicly available records. To have your information removed, we recommend requesting removal directly through your county’s website.
| Date | Status | Borrower | Loan Amount |
|---|---|---|---|
| Previous Owner | $551,200 |
Tax History
We collect this data history from publicly available records. To have your information removed, we recommend requesting removal directly through your county’s website.
| Year | Tax Paid | Tax Assessment Tax Assessment Total Assessment is a certain percentage of the fair market value that is determined by local assessors to be the total taxable value of land and additions on the property. | Land | Improvement |
|---|---|---|---|---|
| 2025 | $10,627 | $1,038,800 | $421,000 | $617,800 |
| 2024 | $10,337 | $976,100 | $401,000 | $575,100 |
| 2023 | $10,089 | $908,900 | $361,000 | $547,900 |
| 2022 | $8,970 | $861,700 | $341,000 | $520,700 |
| 2021 | $9,034 | $834,900 | $321,000 | $513,900 |
| 2020 | $8,738 | $809,800 | $311,000 | $498,800 |
| 2019 | $8,219 | $732,500 | $291,000 | $441,500 |
| 2018 | $7,955 | $679,300 | $271,000 | $408,300 |
| 2017 | $7,923 | $639,500 | $261,000 | $378,500 |
| 2016 | $7,503 | $590,800 | $241,000 | $349,800 |
| 2015 | $7,453 | $575,100 | $241,000 | $334,100 |
| 2014 | $7,440 | $551,500 | $231,000 | $320,500 |
Map
- 115 Collincote St
- 54 Endicott Rd
- 48 Macarthur Rd
- 62 High St Unit Lot 8
- 159 Main St Unit 47C
- 159 Main St Unit 23C
- 159 Main St Unit 11C
- 159 Main St Unit 44C
- 159 Main St Unit 54A
- 122 Main St Unit 100
- 122 Main St Unit 402
- 12 Brackett Ave
- 15 Garden Rd
- 17 Garden Rd
- 380 Albion St
- 66 Main St Unit 28A
- 66 Main St Unit 11A
- 32 Oak St
- 126 Green St
- 47 Winship Dr
Ask me questions while you tour the home.