33 Kelsey Rd Clinton, CT 06413
Estimated Value: $444,303 - $603,000
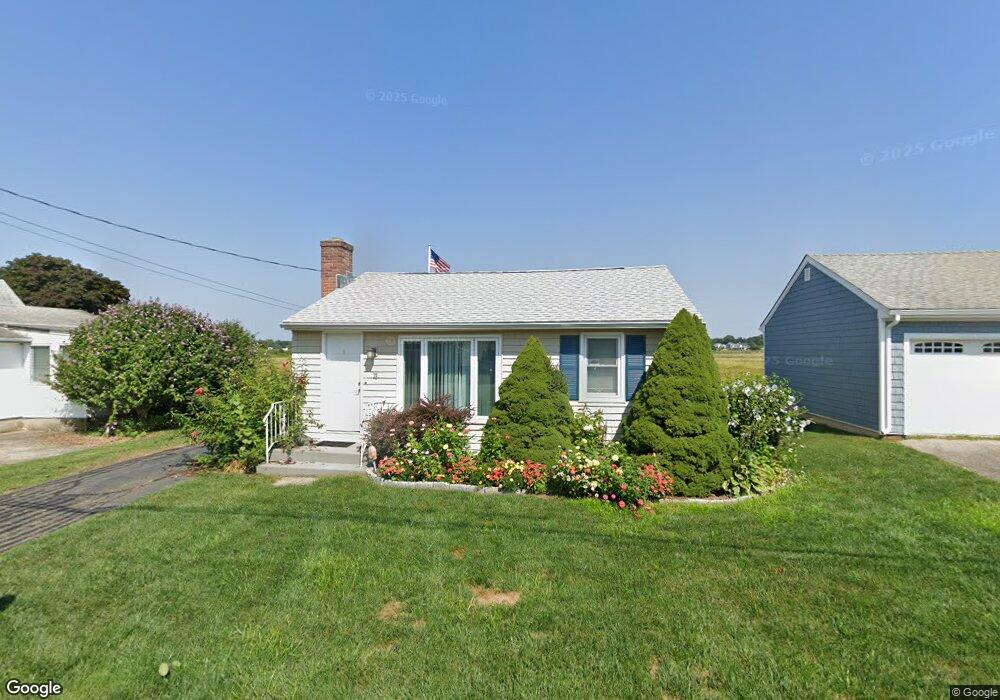
About This Home
This home is located at 33 Kelsey Rd, Clinton, CT 06413 and is currently estimated at $546,326, approximately $669 per square foot. 33 Kelsey Rd is a home located in Middlesex County with nearby schools including Lewin G. Joel Jr. School and The Morgan School.
Ownership History
We collect this data history from publicly available records. To have your information removed, we recommend requesting removal directly through your county’s website.
Purchase Details
Purchase Details
Purchase Details
Home Financials for this Owner
Home Financials are based on the most recent Mortgage that was taken out on this home.Home Values in the Area
Average Home Value in this Area
Purchase History
We collect this data history from publicly available records. To have your information removed, we recommend requesting removal directly through your county’s website.
| Date | Buyer | Sale Price | Title Company |
|---|---|---|---|
| -- | None Available | ||
| -- | None Available | ||
| -- | None Available | ||
| -- | None Available | ||
| $324,000 | None Available | ||
| $324,000 | None Available |
Mortgage History
We collect this data history from publicly available records. To have your information removed, we recommend requesting removal directly through your county’s website.
| Date | Status | Borrower | Loan Amount |
|---|---|---|---|
| Previous Owner | $318,131 |
Tax History
We collect this data history from publicly available records. To have your information removed, we recommend requesting removal directly through your county’s website.
| Year | Tax Paid | Tax Assessment Tax Assessment Total Assessment is a certain percentage of the fair market value that is determined by local assessors to be the total taxable value of land and additions on the property. | Land | Improvement |
|---|---|---|---|---|
| 2025 | $6,897 | $221,478 | $145,578 | $75,900 |
| 2024 | $6,702 | $221,478 | $145,578 | $75,900 |
| 2023 | $6,607 | $221,478 | $145,578 | $75,900 |
| 2022 | $6,607 | $221,478 | $145,578 | $75,900 |
| 2021 | $5,256 | $176,200 | $104,700 | $71,500 |
| 2020 | $5,506 | $176,200 | $104,700 | $71,500 |
| 2019 | $5,506 | $176,200 | $104,700 | $71,500 |
| 2018 | $5,381 | $176,200 | $104,700 | $71,500 |
| 2017 | $5,270 | $176,200 | $104,700 | $71,500 |
| 2016 | $4,782 | $176,200 | $104,700 | $71,500 |
| 2015 | $4,307 | $160,900 | $95,200 | $65,700 |
| 2014 | $4,227 | $160,900 | $95,200 | $65,700 |
Map
- 40 Uncas Rd
- 49 Hammock Rd
- 5 Loop Rd Unit 5A
- 2 Osprey Commons
- 24 Indian Dr
- 31 Sols Point Rd
- 26 Indian Dr
- 116 Commerce St Unit 5
- 192 E Main St
- 0 E Main St
- 20 Plymouth Ct
- 22 Morgan Park
- 99 Shore Rd
- 153 E Main St Unit 13
- 153 E Main St Unit 31
- 153 E Main St Unit 8
- 153 E Main St Unit 9
- 153 E Main St Unit 6
- 153 E Main St Unit 7
- 153 E Main St Unit 32
Ask me questions while you tour the home.