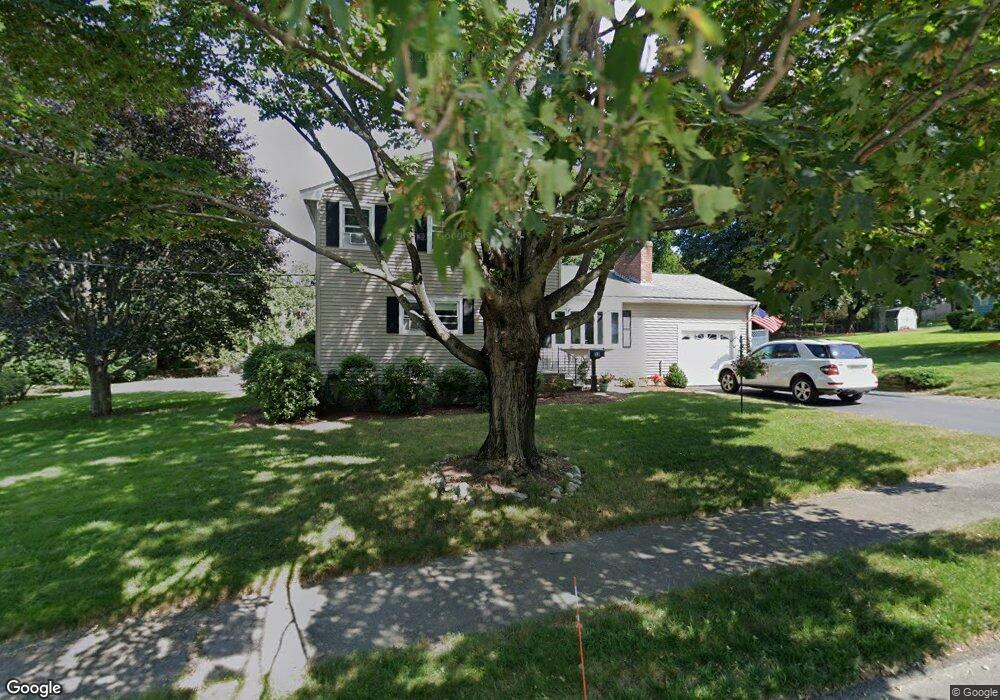
33 Kieran Rd Reading, MA 01867
Estimated Value: $887,000 - $1,009,000
5
Beds
2
Baths
1,796
Sq Ft
$521/Sq Ft
Est. Value
About This Home
This home is located at 33 Kieran Rd, Reading, MA 01867 and is currently estimated at $936,399, approximately $521 per square foot. 33 Kieran Rd is a home located in Middlesex County with nearby schools including Wood End Elementary School, Arthur W. Coolidge Middle School, and Reading Memorial High School.
Ownership History
Date
Name
Owned For
Owner Type
Purchase Details
Closed on
Jun 14, 2021
Sold by
Wadland Charles P and Wadland Virginia M
Bought by
Wadland Ft and Wadland
Current Estimated Value
Purchase Details
Closed on
Oct 5, 1979
Bought by
Wadland Charles P and Wadland Virginia M
Create a Home Valuation Report for This Property
The Home Valuation Report is an in-depth analysis detailing your home's value as well as a comparison with similar homes in the area
Home Values in the Area
Average Home Value in this Area
Purchase History
| Date | Buyer | Sale Price | Title Company |
|---|---|---|---|
| Wadland Ft | -- | None Available | |
| Wadland Charles P | $55,000 | -- |
Source: Public Records
Mortgage History
| Date | Status | Borrower | Loan Amount |
|---|---|---|---|
| Previous Owner | Wadland Charles P | $150,000 | |
| Previous Owner | Wadland Charles P | $25,000 |
Source: Public Records
Tax History
| Year | Tax Paid | Tax Assessment Tax Assessment Total Assessment is a certain percentage of the fair market value that is determined by local assessors to be the total taxable value of land and additions on the property. | Land | Improvement |
|---|---|---|---|---|
| 2025 | $10,088 | $885,700 | $503,200 | $382,500 |
| 2024 | $9,974 | $851,000 | $483,400 | $367,600 |
| 2023 | $9,665 | $767,700 | $435,800 | $331,900 |
| 2022 | $9,308 | $698,300 | $396,200 | $302,100 |
| 2021 | $9,122 | $660,500 | $379,600 | $280,900 |
| 2020 | $8,773 | $628,900 | $361,300 | $267,600 |
| 2019 | $8,527 | $599,200 | $344,100 | $255,100 |
| 2018 | $7,841 | $565,300 | $324,500 | $240,800 |
| 2017 | $7,485 | $533,500 | $306,100 | $227,400 |
| 2016 | $6,467 | $446,000 | $274,300 | $171,700 |
| 2015 | $6,064 | $412,500 | $253,500 | $159,000 |
| 2014 | $5,877 | $398,700 | $244,900 | $153,800 |
Source: Public Records
Map
Nearby Homes
- 31 Zachary Ln
- 194 Sanborn Ln
- 119 Van Norden Rd
- 37 Fairchild Dr
- 115 Forest St
- 43 Ashley Place
- 150 Grove St
- 61 Beaver Rd
- 34 Plymouth Rd
- 64 Longfellow Rd
- 35 Longfellow Rd
- 36 Main St Unit 1
- 36 Main St Unit 29
- 36 Main St Unit 26
- 89 Grand St
- 863 Main St
- 584 Woburn St
- 300 Woburn St
- 430 West St
- 197 Wildwood St
Your Personal Tour Guide
Ask me questions while you tour the home.