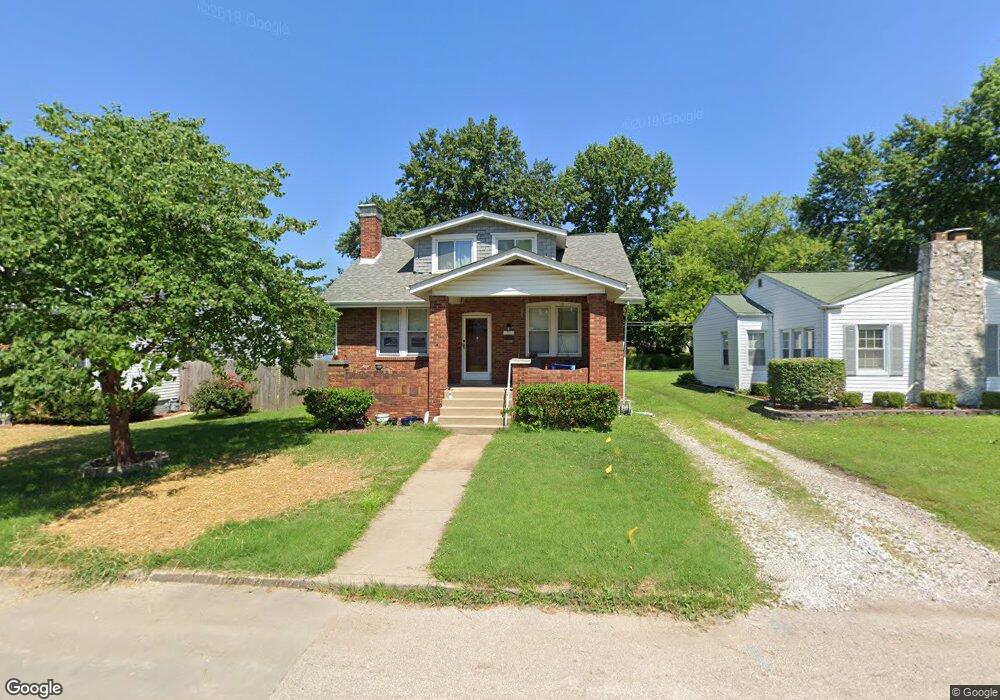
33 N 39th St Belleville, IL 62226
Estimated Value: $147,000 - $164,000
3
Beds
2
Baths
1,680
Sq Ft
$91/Sq Ft
Est. Value
About This Home
This home is located at 33 N 39th St, Belleville, IL 62226 and is currently estimated at $153,291, approximately $91 per square foot. 33 N 39th St is a home located in St. Clair County with nearby schools including Union Elementary School, West Jr High School, and Our Lady Queen Of Peace Catholic School.
Ownership History
Date
Name
Owned For
Owner Type
Purchase Details
Closed on
Jul 12, 2011
Sold by
Fannie Mae
Bought by
Schlattweiler Barbara L and Schlattweiler Eugene H
Current Estimated Value
Purchase Details
Closed on
May 21, 2010
Sold by
Mcgraw Kimberley
Bought by
Federal National Mortgage Association
Purchase Details
Closed on
Oct 25, 2006
Sold by
Tastad Jerome W and Brown Randal S
Bought by
Mcgraw Kimberley
Home Financials for this Owner
Home Financials are based on the most recent Mortgage that was taken out on this home.
Original Mortgage
$108,900
Interest Rate
6.5%
Mortgage Type
Purchase Money Mortgage
Purchase Details
Closed on
May 23, 2006
Sold by
Northway
Bought by
Tastad Jerome W
Purchase Details
Closed on
Apr 30, 2002
Sold by
Wallace Christopher D and Wallace Teri B
Bought by
Northway Nathan D and Bujnak Amanda M
Home Financials for this Owner
Home Financials are based on the most recent Mortgage that was taken out on this home.
Original Mortgage
$68,500
Interest Rate
7.18%
Mortgage Type
Purchase Money Mortgage
Create a Home Valuation Report for This Property
The Home Valuation Report is an in-depth analysis detailing your home's value as well as a comparison with similar homes in the area
Home Values in the Area
Average Home Value in this Area
Purchase History
We collect this data history from publicly available records. To have your information removed, we recommend requesting removal directly through your county’s website.
| Date | Buyer | Sale Price | Title Company |
|---|---|---|---|
| Schlattweiler Barbara L | $44,000 | None Available | |
| Federal National Mortgage Association | -- | None Available | |
| Mcgraw Kimberley | $109,000 | Benchmark Title Company | |
| Tastad Jerome W | $77,000 | None Available | |
| Northway Nathan D | $73,500 | First American Title Ins |
Source: Public Records
Mortgage History
We collect this data history from publicly available records. To have your information removed, we recommend requesting removal directly through your county’s website.
| Date | Status | Borrower | Loan Amount |
|---|---|---|---|
| Previous Owner | Mcgraw Kimberley | $108,900 | |
| Previous Owner | Northway Nathan D | $68,500 |
Source: Public Records
Tax History
| Year | Tax Paid | Tax Assessment Tax Assessment Total Assessment is a certain percentage of the fair market value that is determined by local assessors to be the total taxable value of land and additions on the property. | Land | Improvement |
|---|---|---|---|---|
| 2024 | $3,197 | $42,361 | $3,658 | $38,703 |
| 2023 | $3,182 | $39,899 | $3,586 | $36,313 |
| 2022 | $2,864 | $35,919 | $3,228 | $32,691 |
| 2021 | $2,713 | $33,206 | $2,984 | $30,222 |
| 2020 | $2,611 | $31,402 | $2,822 | $28,580 |
| 2019 | $2,545 | $30,564 | $2,827 | $27,737 |
| 2018 | $2,475 | $29,903 | $2,766 | $27,137 |
| 2017 | $2,457 | $29,692 | $2,746 | $26,946 |
| 2016 | $3,033 | $29,062 | $2,688 | $26,374 |
| 2014 | $701 | $13,580 | $3,549 | $10,031 |
| 2013 | -- | $13,774 | $3,600 | $10,174 |
Source: Public Records
Map
Nearby Homes
- 19 N 40th St
- 3816 W Main St
- 3709 W Main St
- 109 S 38th St
- 3519 W A St
- 108 S 37th St
- 3700 Michelle Dr
- 439 N 39th St
- 105 N 35th St
- 3520 Summit Ave
- 140 S 35th St
- 3706 Little Flower Ln
- 3805 Little Flower Ln
- 507 N 37th St
- 3505 Sheridan Ave
- 129 N 44th St
- 4521 N Belt W
- 3202 W Main St
- 110 S 32nd St
- 120 N 46th St
Your Personal Tour Guide
Ask me questions while you tour the home.