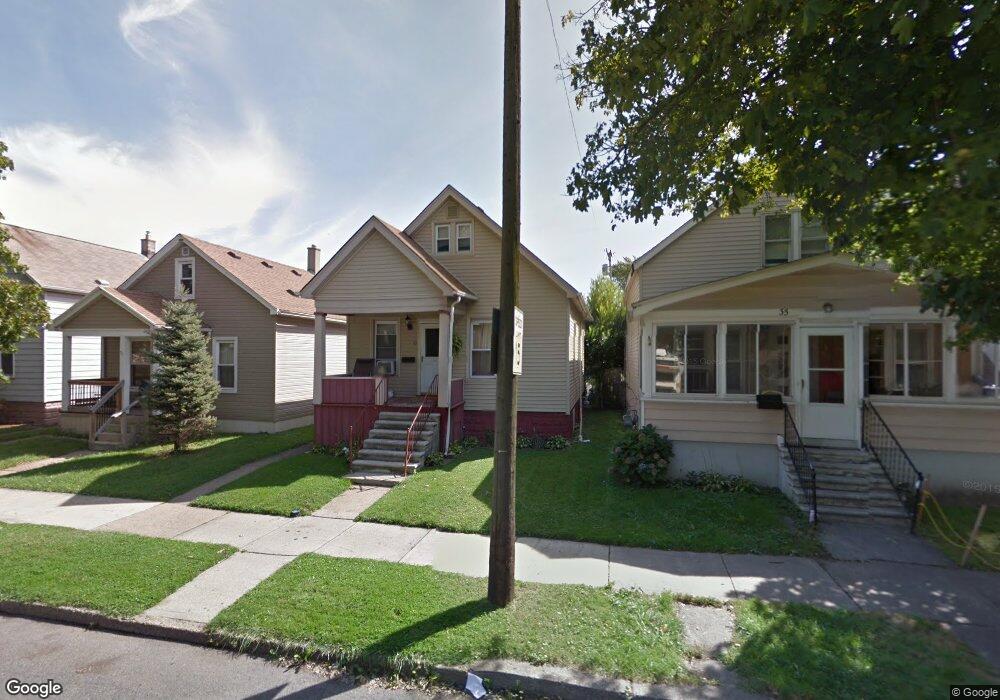
33 Perrin St River Rouge, MI 48218
Estimated Value: $82,000 - $113,000
Studio
--
Bath
1,056
Sq Ft
$95/Sq Ft
Est. Value
About This Home
This home is located at 33 Perrin St, River Rouge, MI 48218 and is currently estimated at $100,159, approximately $94 per square foot. 33 Perrin St is a home located in Wayne County with nearby schools including Ann Visger K-5 Preparatory Academy.
Ownership History
Date
Name
Owned For
Owner Type
Purchase Details
Closed on
Sep 18, 2019
Sold by
Fifth Third Bank
Bought by
Luna Antonio
Current Estimated Value
Purchase Details
Closed on
Jul 11, 2019
Sold by
Perez Kristine and Luciani Darnette
Bought by
Fifth Third Bank
Purchase Details
Closed on
Mar 26, 2004
Sold by
Carter Eugene C and Carter Wanda K
Bought by
Mauricio Kristine
Purchase Details
Closed on
Feb 3, 2003
Sold by
Option One Mortgage Corp
Bought by
Carter Eugene C
Purchase Details
Closed on
Apr 4, 2002
Sold by
Agnew Cortrelle
Bought by
Option One Mtg Corp
Create a Home Valuation Report for This Property
The Home Valuation Report is an in-depth analysis detailing your home's value as well as a comparison with similar homes in the area
Home Values in the Area
Average Home Value in this Area
Purchase History
We collect this data history from publicly available records. To have your information removed, we recommend requesting removal directly through your county’s website.
| Date | Buyer | Sale Price | Title Company |
|---|---|---|---|
| Luna Antonio | $19,170 | None Listed On Document | |
| Fifth Third Bank | $20,250 | None Available | |
| Mauricio Kristine | $61,300 | Multiple | |
| Carter Eugene C | $30,000 | First American Title | |
| Option One Mtg Corp | $52,071 | -- |
Source: Public Records
Tax History
| Year | Tax Paid | Tax Assessment Tax Assessment Total Assessment is a certain percentage of the fair market value that is determined by local assessors to be the total taxable value of land and additions on the property. | Land | Improvement |
|---|---|---|---|---|
| 2025 | $1,602 | $35,800 | $0 | $0 |
| 2024 | $1,228 | $30,700 | $0 | $0 |
| 2023 | $1,182 | $24,100 | $0 | $0 |
| 2022 | $2,053 | $18,500 | $0 | $0 |
| 2021 | $1,602 | $15,700 | $0 | $0 |
| 2020 | $1,321 | $13,400 | $0 | $0 |
| 2019 | $627 | $12,000 | $0 | $0 |
| 2018 | $612 | $11,400 | $0 | $0 |
| 2017 | $744 | $11,700 | $0 | $0 |
| 2016 | $1,020 | $12,000 | $0 | $0 |
| 2015 | $1,200 | $12,000 | $0 | $0 |
| 2013 | $2,350 | $24,700 | $0 | $0 |
| 2012 | $2,130 | $24,100 | $3,200 | $20,900 |
Source: Public Records
Map
Nearby Homes
Your Personal Tour Guide
Ask me questions while you tour the home.