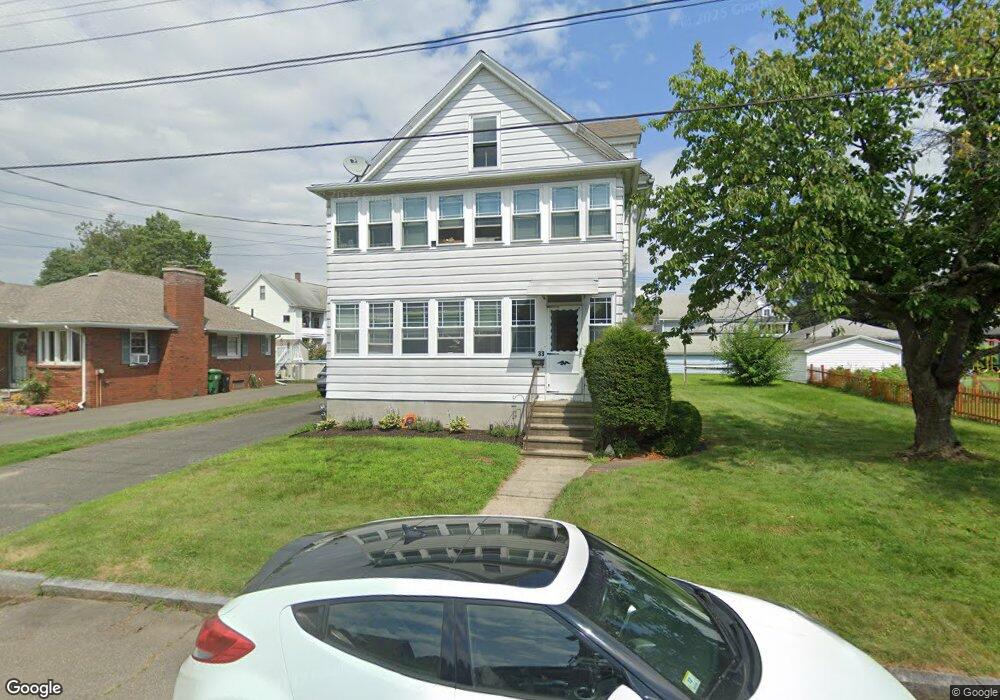
33 Van Horn St Chicopee, MA 01013
Chicopee Center NeighborhoodEstimated Value: $266,000 - $371,000
3
Beds
2
Baths
1,768
Sq Ft
$175/Sq Ft
Est. Value
About This Home
This home is located at 33 Van Horn St, Chicopee, MA 01013 and is currently estimated at $309,594, approximately $175 per square foot. 33 Van Horn St is a home located in Hampden County with nearby schools including Bowe Elementary School, Fairview Middle School, and Chicopee High School.
Ownership History
Date
Name
Owned For
Owner Type
Purchase Details
Closed on
May 12, 2005
Sold by
Drenzek Frank
Bought by
Kumiega Francine M and Kumiega James A
Current Estimated Value
Home Financials for this Owner
Home Financials are based on the most recent Mortgage that was taken out on this home.
Original Mortgage
$105,000
Outstanding Balance
$55,484
Interest Rate
6.05%
Mortgage Type
Purchase Money Mortgage
Estimated Equity
$254,110
Create a Home Valuation Report for This Property
The Home Valuation Report is an in-depth analysis detailing your home's value as well as a comparison with similar homes in the area
Home Values in the Area
Average Home Value in this Area
Purchase History
We collect this data history from publicly available records. To have your information removed, we recommend requesting removal directly through your county’s website.
| Date | Buyer | Sale Price | Title Company |
|---|---|---|---|
| Kumiega Francine M | $135,000 | -- |
Source: Public Records
Mortgage History
We collect this data history from publicly available records. To have your information removed, we recommend requesting removal directly through your county’s website.
| Date | Status | Borrower | Loan Amount |
|---|---|---|---|
| Open | Kumiega Francine M | $105,000 |
Source: Public Records
Tax History
| Year | Tax Paid | Tax Assessment Tax Assessment Total Assessment is a certain percentage of the fair market value that is determined by local assessors to be the total taxable value of land and additions on the property. | Land | Improvement |
|---|---|---|---|---|
| 2025 | $4,131 | $272,500 | $88,500 | $184,000 |
| 2024 | $3,913 | $265,100 | $86,800 | $178,300 |
| 2023 | $3,662 | $241,700 | $78,900 | $162,800 |
| 2022 | $3,595 | $211,600 | $68,600 | $143,000 |
| 2021 | $3,420 | $194,200 | $62,400 | $131,800 |
| 2020 | $3,225 | $184,700 | $62,400 | $122,300 |
| 2019 | $3,165 | $176,200 | $62,400 | $113,800 |
| 2018 | $3,094 | $169,000 | $59,400 | $109,600 |
| 2017 | $2,820 | $162,900 | $59,400 | $103,500 |
| 2016 | $2,662 | $157,400 | $59,400 | $98,000 |
| 2015 | $2,766 | $157,700 | $59,400 | $98,300 |
| 2014 | $1,383 | $157,700 | $59,400 | $98,300 |
Source: Public Records
Map
Nearby Homes
- 44 White St
- 2 Marion St
- 75 Wheatland Ave
- 250 School St
- 582 Broadway St
- 35 Lower Grape St
- 85 Farnsworth St
- 115 Connecticut Ave
- 156 South St
- 130 Connecticut Ave
- 18 Los Angeles St
- 177 Marion St
- 0 School St
- 827-831 Armory St
- 70 Norman St
- 22 Felicia St
- 907-909 Liberty St
- 151 Edgewood Ave
- 118 Edgewood Ave
- 221 East St
Your Personal Tour Guide
Ask me questions while you tour the home.