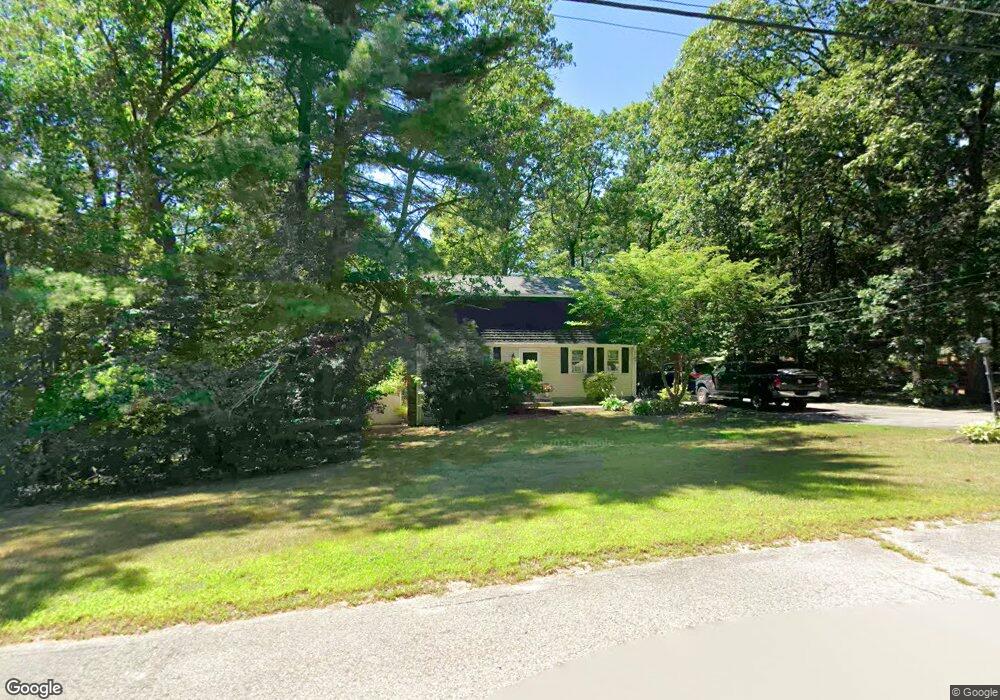
330 Bennett St Wrentham, MA 02093
Estimated Value: $637,676 - $1,065,000
3
Beds
2
Baths
1,728
Sq Ft
$441/Sq Ft
Est. Value
About This Home
This home is located at 330 Bennett St, Wrentham, MA 02093 and is currently estimated at $761,919, approximately $440 per square foot. 330 Bennett St is a home located in Norfolk County with nearby schools including Delaney Elementary School, Charles E Roderick, and Mercymount Country Day School.
Ownership History
Date
Name
Owned For
Owner Type
Purchase Details
Closed on
Nov 9, 1988
Sold by
Sherwood Douglas
Bought by
Small John M
Current Estimated Value
Home Financials for this Owner
Home Financials are based on the most recent Mortgage that was taken out on this home.
Original Mortgage
$142,300
Interest Rate
10.36%
Mortgage Type
Purchase Money Mortgage
Create a Home Valuation Report for This Property
The Home Valuation Report is an in-depth analysis detailing your home's value as well as a comparison with similar homes in the area
Purchase History
| Date | Buyer | Sale Price | Title Company |
|---|---|---|---|
| Small John M | $158,000 | -- |
Source: Public Records
Mortgage History
| Date | Status | Borrower | Loan Amount |
|---|---|---|---|
| Open | Small John M | $202,000 | |
| Closed | Small John M | $135,500 | |
| Closed | Small John M | $139,500 | |
| Closed | Small John M | $142,300 |
Source: Public Records
Tax History
| Year | Tax Paid | Tax Assessment Tax Assessment Total Assessment is a certain percentage of the fair market value that is determined by local assessors to be the total taxable value of land and additions on the property. | Land | Improvement |
|---|---|---|---|---|
| 2025 | $6,284 | $542,200 | $302,100 | $240,100 |
| 2024 | $6,103 | $508,600 | $302,100 | $206,500 |
| 2023 | $5,933 | $470,100 | $274,500 | $195,600 |
| 2022 | $5,788 | $423,400 | $256,000 | $167,400 |
| 2021 | $5,459 | $388,000 | $223,400 | $164,600 |
| 2020 | $5,280 | $370,500 | $198,600 | $171,900 |
| 2019 | $5,231 | $370,500 | $198,600 | $171,900 |
| 2018 | $4,635 | $325,500 | $169,000 | $156,500 |
| 2017 | $4,385 | $307,700 | $165,800 | $141,900 |
| 2016 | $4,201 | $294,200 | $161,000 | $133,200 |
| 2015 | $4,073 | $271,900 | $154,700 | $117,200 |
| 2014 | $4,028 | $263,100 | $148,800 | $114,300 |
Source: Public Records
Map
Nearby Homes
- 1204 South St
- 1222 South St
- 2 Earle Stewart Ln
- 19 Chestnut St Lot 2
- 19 Chestnut St Lot 3
- 54 Elysium St
- 6 Woodchester Rd
- 165 Wampum St
- 1 Chestnut St
- 215 South St
- 0 Fall Ln
- 10 Nature View Dr
- 15 Nature View Dr
- 18 Manchester Dr
- 8 Aspen Way
- 29 Forest St
- 3 Oak View Terrace Unit 3
- 35 Paddock Dr
- 90 E Central St Unit 304
- 1 Washington St
- 320 Bennett St
- 331 Bennett St
- 345 Bennett St
- 325 Bennett St
- 350 Bennett St
- 355 Bennett St
- 337 Bennett St
- 318 Bennett St
- 370 Bennett St
- 305 Bennett St
- 305 Bennett St Unit 305
- 365 Bennett St
- 315 Bennett St
- 375 Bennett St
- 314 Bennett St
- 295 Bennett St
- 285 Bennett St
- 390 West St
- 275 Bennett St
- 304 Bennett St
Your Personal Tour Guide
Ask me questions while you tour the home.