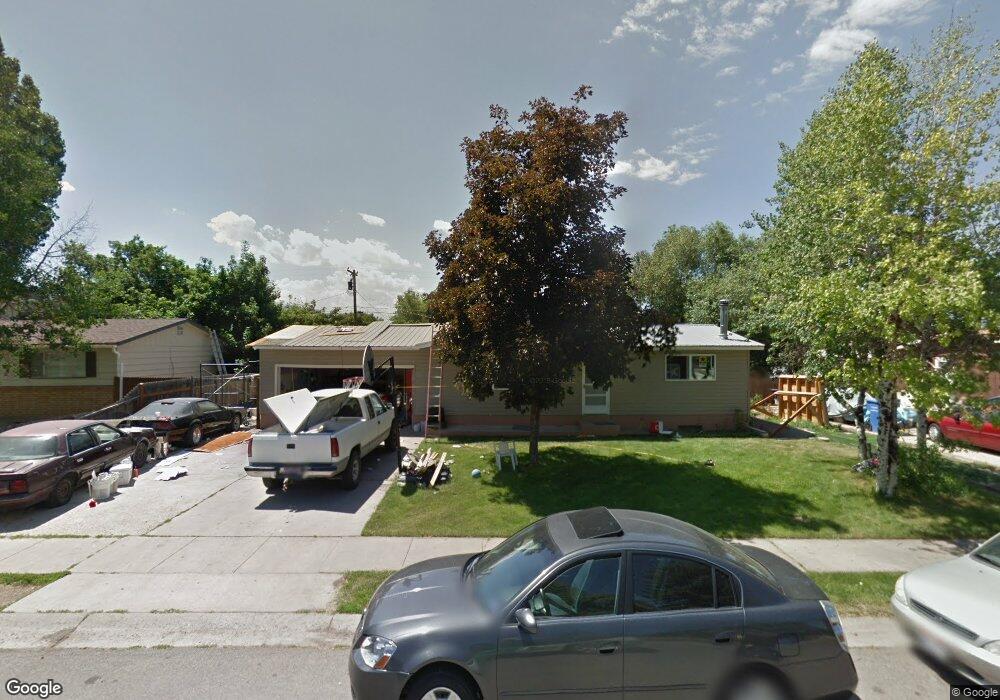
330 E 120 S Smithfield, UT 84335
Estimated Value: $343,000 - $388,000
3
Beds
2
Baths
1,824
Sq Ft
$198/Sq Ft
Est. Value
About This Home
This home is located at 330 E 120 S, Smithfield, UT 84335 and is currently estimated at $361,917, approximately $198 per square foot. 330 E 120 S is a home located in Cache County with nearby schools including Sunrise School, Cedar Ridge School, and North Cache Middle School.
Ownership History
Date
Name
Owned For
Owner Type
Purchase Details
Closed on
Aug 7, 2019
Sold by
Mejia Vannesa
Bought by
Mejia Manuel
Current Estimated Value
Purchase Details
Closed on
Feb 25, 2002
Sold by
Dever Douglas L and Dever Natalie
Bought by
Rushing Jake and Rushing Shawna
Home Financials for this Owner
Home Financials are based on the most recent Mortgage that was taken out on this home.
Original Mortgage
$103,405
Outstanding Balance
$41,534
Interest Rate
6.8%
Estimated Equity
$320,383
Create a Home Valuation Report for This Property
The Home Valuation Report is an in-depth analysis detailing your home's value as well as a comparison with similar homes in the area
Home Values in the Area
Average Home Value in this Area
Purchase History
| Date | Buyer | Sale Price | Title Company |
|---|---|---|---|
| Mejia Manuel | -- | Accommodation | |
| Rushing Jake | -- | American Secure Title |
Source: Public Records
Mortgage History
| Date | Status | Borrower | Loan Amount |
|---|---|---|---|
| Open | Rushing Jake | $103,405 |
Source: Public Records
Tax History
| Year | Tax Paid | Tax Assessment Tax Assessment Total Assessment is a certain percentage of the fair market value that is determined by local assessors to be the total taxable value of land and additions on the property. | Land | Improvement |
|---|---|---|---|---|
| 2025 | $1,332 | $178,355 | $0 | $0 |
| 2024 | $1,380 | $173,345 | $0 | $0 |
| 2023 | $1,440 | $170,975 | $0 | $0 |
| 2022 | $146 | $170,975 | $0 | $0 |
| 2021 | $1,430 | $255,280 | $70,000 | $185,280 |
| 2020 | $1,348 | $224,400 | $70,000 | $154,400 |
| 2019 | $1,095 | $173,856 | $45,000 | $128,856 |
| 2018 | $1,004 | $154,200 | $45,000 | $109,200 |
| 2017 | $935 | $78,375 | $0 | $0 |
| 2016 | $951 | $78,375 | $0 | $0 |
| 2015 | $955 | $78,375 | $0 | $0 |
| 2014 | $800 | $66,955 | $0 | $0 |
| 2013 | -- | $66,955 | $0 | $0 |
Source: Public Records
Map
Nearby Homes
Your Personal Tour Guide
Ask me questions while you tour the home.