M
Seller's Agent in 2018
Michael Harney
Foley Realty Group, Inc.


Estimated Value: $1,105,000 - $1,602,103
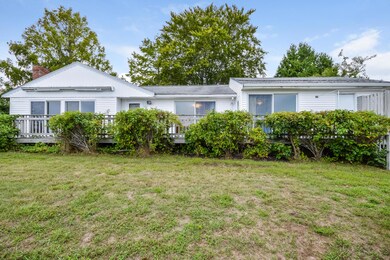
Waterfront home overlooking Washburn Island! !opportunity abounds!
Last Agent to Sell the Property
Michael Harney
Foley Realty Group, Inc. Listed on: 09/26/2018
Last Buyer's Agent
Sally Duffy
Sotheby's International Realty License #9075707
We collect this data history from publicly available records. To have your information removed, we recommend requesting removal directly through your county’s website.
We collect this data history from publicly available records. To have your information removed, we recommend requesting removal directly through your county’s website.
| Date | Buyer | Sale Price | Title Company |
|---|---|---|---|
| -- | None Available | ||
| -- | None Available | ||
| $642,000 | -- | ||
| $642,000 | -- | ||
| $13,000 | -- | ||
| $13,000 | -- | ||
| $255,000 | -- | ||
| $255,000 | -- |
We collect this data history from publicly available records. To have your information removed, we recommend requesting removal directly through your county’s website.
| Date | Status | Borrower | Loan Amount |
|---|---|---|---|
| Previous Owner | $475,000 | ||
| Previous Owner | $200,000 |
We collect this data history from publicly available records. To have your information removed, we recommend requesting removal directly through your county’s website.
| Date | Event | Price | List to Sale | Price per Sq Ft |
|---|---|---|---|---|
| 12/21/2018 12/21/18 | Sold | $642,000 | -8.2% | $493 / Sq Ft |
| 12/13/2018 12/13/18 | Pending | -- | -- | -- |
| 09/27/2018 09/27/18 | For Sale | $699,000 | -- | $536 / Sq Ft |
We collect this data history from publicly available records. To have your information removed, we recommend requesting removal directly through your county’s website.
| Year | Tax Paid | Tax Assessment Tax Assessment Total Assessment is a certain percentage of the fair market value that is determined by local assessors to be the total taxable value of land and additions on the property. | Land | Improvement |
|---|---|---|---|---|
| 2025 | $7,185 | $1,224,000 | $685,500 | $538,500 |
| 2024 | $6,821 | $1,086,100 | $596,100 | $490,000 |
| 2023 | $6,109 | $882,800 | $566,300 | $316,500 |
| 2022 | $6,204 | $770,700 | $504,900 | $265,800 |
| 2021 | $6,338 | $745,700 | $504,900 | $240,800 |
| 2020 | $5,614 | $653,600 | $459,000 | $194,600 |
| 2019 | $5,372 | $627,600 | $459,000 | $168,600 |
| 2018 | $5,404 | $618,000 | $459,000 | $159,000 |
| 2017 | $5,228 | $612,900 | $459,000 | $153,900 |
| 2016 | $5,130 | $612,900 | $459,000 | $153,900 |
| 2015 | $5,020 | $612,900 | $459,000 | $153,900 |
| 2014 | $4,993 | $612,600 | $459,000 | $153,600 |
M
Seller's Agent in 2018
Michael Harney
Foley Realty Group, Inc.
S
Buyer's Agent in 2018
Sally Duffy
Sotheby's International Realty
Source: Cape Cod & Islands Association of REALTORS®
MLS Number: 21807440
APN: FALM-000041-000006-000000-000006
Disclaimer: Certain information contained herein is derived from information provided by parties other than Homes.com. All information provided is deemed reliable, but is not guaranteed to be accurate and should be independently verified.
![]() All data relating to real estate for sale on this page comes from the Broker Reciprocity (BR) of the Cape Cod & Islands Multiple Listing Service, Inc. Detailed information about real estate listings held by brokerage firms other than CC&I Assoc. of REALTORS®, Inc. includes the name of the listing company. Neither the listing company nor CC&I Assoc. of REALTORS®, Inc. shall be responsible for any typographical errors, misinformation, misprints and shall be held totally harmless. The Broker providing this data believes it to be correct, but advises interested parties to confirm any item before relying on it in a purchase decision. All properties are subject to prior sale, changes, or withdrawal. Copyright 2026 © Cape Cod & Islands Multiple Listing Service, Inc. All rights reserved.
All data relating to real estate for sale on this page comes from the Broker Reciprocity (BR) of the Cape Cod & Islands Multiple Listing Service, Inc. Detailed information about real estate listings held by brokerage firms other than CC&I Assoc. of REALTORS®, Inc. includes the name of the listing company. Neither the listing company nor CC&I Assoc. of REALTORS®, Inc. shall be responsible for any typographical errors, misinformation, misprints and shall be held totally harmless. The Broker providing this data believes it to be correct, but advises interested parties to confirm any item before relying on it in a purchase decision. All properties are subject to prior sale, changes, or withdrawal. Copyright 2026 © Cape Cod & Islands Multiple Listing Service, Inc. All rights reserved.
Ask me questions while you tour the home.