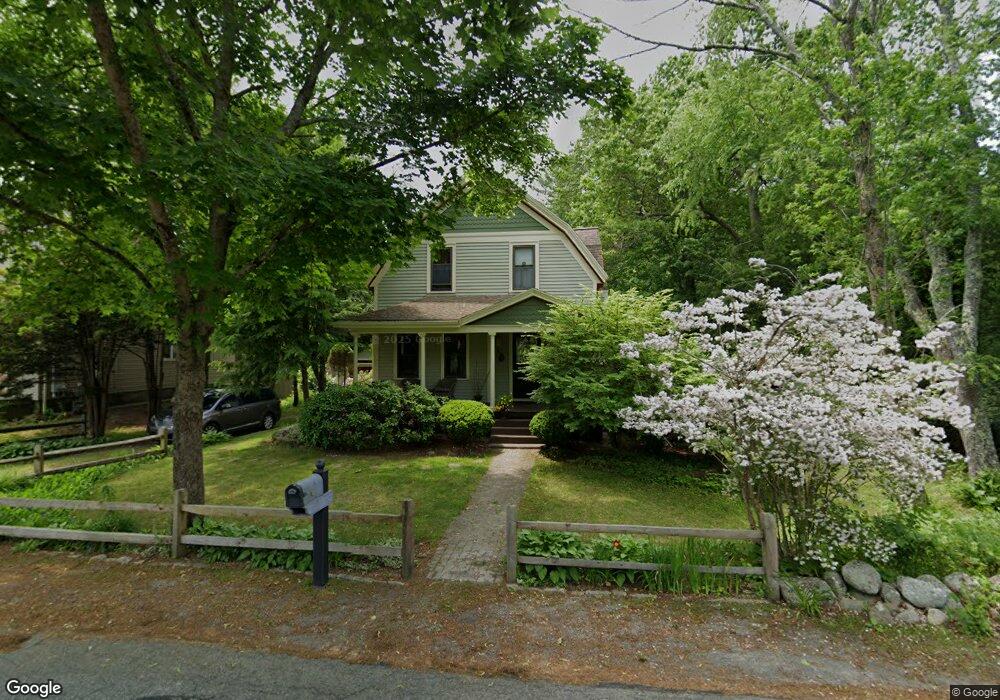
330 Spring St West Bridgewater, MA 02379
Estimated Value: $513,000 - $628,000
About This Home
This home is located at 330 Spring St, West Bridgewater, MA 02379 and is currently estimated at $564,663, approximately $341 per square foot. 330 Spring St is a home located in Plymouth County with nearby schools including Spring Street Elementary School, Rose L. MacDonald Elementary School, and Howard Elementary School.
Ownership History
We collect this data history from publicly available records. To have your information removed, we recommend requesting removal directly through your county’s website.
Purchase Details
Home Financials for this Owner
Home Financials are based on the most recent Mortgage that was taken out on this home.Home Values in the Area
Average Home Value in this Area
Purchase History
We collect this data history from publicly available records. To have your information removed, we recommend requesting removal directly through your county’s website.
| Date | Buyer | Sale Price | Title Company |
|---|---|---|---|
| $142,500 | -- |
Mortgage History
We collect this data history from publicly available records. To have your information removed, we recommend requesting removal directly through your county’s website.
| Date | Status | Borrower | Loan Amount |
|---|---|---|---|
| Open | $102,750 | ||
| Closed | $114,250 | ||
| Closed | $112,500 | ||
| Closed | $112,500 |
Tax History
We collect this data history from publicly available records. To have your information removed, we recommend requesting removal directly through your county’s website.
| Year | Tax Paid | Tax Assessment Tax Assessment Total Assessment is a certain percentage of the fair market value that is determined by local assessors to be the total taxable value of land and additions on the property. | Land | Improvement |
|---|---|---|---|---|
| 2025 | $6,059 | $443,200 | $217,200 | $226,000 |
| 2024 | $5,616 | $396,300 | $196,900 | $199,400 |
| 2023 | $5,461 | $355,300 | $170,500 | $184,800 |
| 2022 | $5,207 | $321,000 | $160,400 | $160,600 |
| 2021 | $9,470 | $300,400 | $160,400 | $140,000 |
| 2020 | $4,855 | $296,600 | $160,400 | $136,200 |
| 2019 | $4,812 | $291,100 | $160,400 | $130,700 |
| 2018 | $9,344 | $274,700 | $152,200 | $122,500 |
| 2017 | $6,588 | $257,200 | $138,000 | $119,200 |
| 2016 | $4,455 | $247,500 | $128,300 | $119,200 |
| 2015 | $4,287 | $240,700 | $128,300 | $112,400 |
| 2014 | $3,969 | $240,700 | $128,300 | $112,400 |
Map
- 85 Crescent St
- 41 Kenneth St
- 14 Fieldstone Terrace
- lot 4 Jeffrey Ln
- 43 Progressive Ave
- 42 Brooks Place
- 30 Grant St
- 53 Brewster Rd
- 260 Crescent St
- 121 Prospect St
- 11 Copper Beech Cir
- 208 W Center St
- 10 Charles St
- 516 Copeland St
- 4 Fairway Dr
- 789 N Main St
- 21 Jason Way
- 4 Liberty St
- 208 Matfield St
- 16 Liberty St
Ask me questions while you tour the home.