331 E Xenia Dr Fairborn, OH 45324
Estimated Value: $154,000 - $184,000
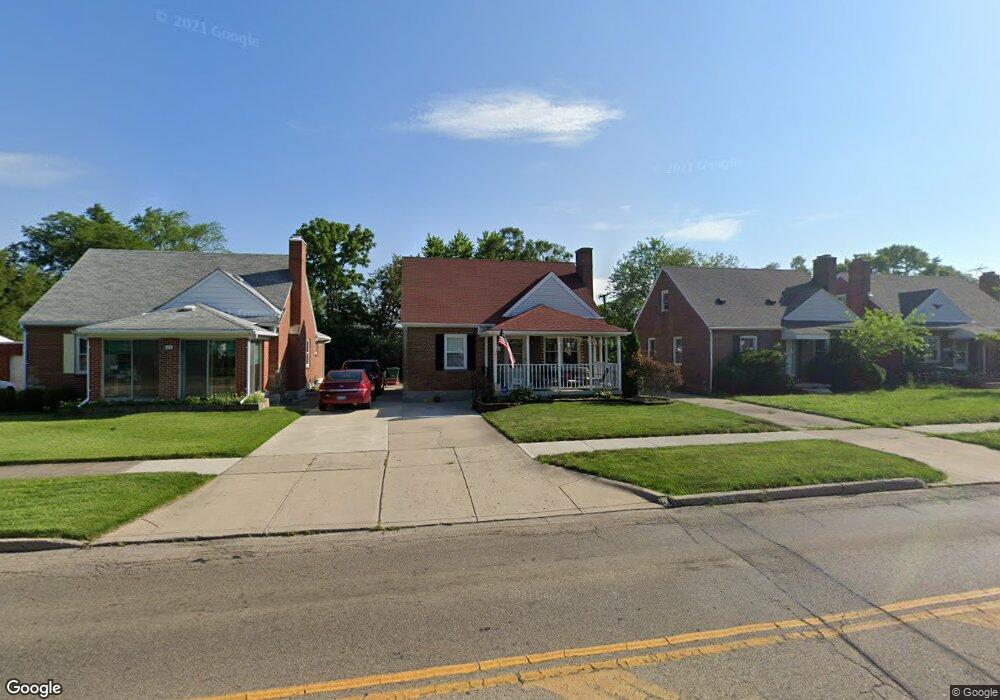
About This Home
This home is located at 331 E Xenia Dr, Fairborn, OH 45324 and is currently estimated at $165,615, approximately $159 per square foot. 331 E Xenia Dr is a home located in Greene County with nearby schools including Fairborn Primary School, Fairborn Intermediate School, and Fairborn Middle School.
Ownership History
We collect this data history from publicly available records. To have your information removed, we recommend requesting removal directly through your county’s website.
Purchase Details
Purchase Details
Purchase Details
Home Financials for this Owner
Home Financials are based on the most recent Mortgage that was taken out on this home.Purchase Details
Home Values in the Area
Average Home Value in this Area
Purchase History
We collect this data history from publicly available records. To have your information removed, we recommend requesting removal directly through your county’s website.
| Date | Buyer | Sale Price | Title Company |
|---|---|---|---|
| $28,000 | Attorney | ||
| $40,000 | Attorney | ||
| $82,900 | Attorney | ||
| $44,000 | -- |
Mortgage History
We collect this data history from publicly available records. To have your information removed, we recommend requesting removal directly through your county’s website.
| Date | Status | Borrower | Loan Amount |
|---|---|---|---|
| Previous Owner | $82,900 |
Tax History
We collect this data history from publicly available records. To have your information removed, we recommend requesting removal directly through your county’s website.
| Year | Tax Paid | Tax Assessment Tax Assessment Total Assessment is a certain percentage of the fair market value that is determined by local assessors to be the total taxable value of land and additions on the property. | Land | Improvement |
|---|---|---|---|---|
| 2025 | $1,379 | $39,420 | $10,240 | $29,180 |
| 2024 | $1,379 | $39,420 | $10,240 | $29,180 |
| 2023 | $1,385 | $39,420 | $10,240 | $29,180 |
| 2022 | $1,105 | $28,620 | $6,020 | $22,600 |
| 2021 | $1,121 | $28,620 | $6,020 | $22,600 |
| 2020 | $1,127 | $28,620 | $6,020 | $22,600 |
| 2019 | $669 | $20,590 | $5,290 | $15,300 |
| 2018 | $676 | $20,590 | $5,290 | $15,300 |
| 2017 | $689 | $20,590 | $5,290 | $15,300 |
| 2016 | $689 | $20,820 | $5,290 | $15,530 |
| 2015 | $656 | $20,820 | $5,290 | $15,530 |
| 2014 | $634 | $20,820 | $5,290 | $15,530 |
Map
- 323 Mann Ave
- 117 N Maple Ave
- 371 Morris Dr
- 000 Morris Dr
- 3 E Xenia Dr
- 37 Hawthorne Dr
- 108 Schneider Dr
- 409 Grant St
- 212 Spruce Dr
- 108 Greene St
- 233 Erie Ave
- 533 Preservation St
- 514 Preservation St
- 108 Frahn Ave
- 226-230 N Broad St
- 590 Chapelgate Dr
- 618 Chapelgate Dr
- 245 Fitchland Dr
- 852 Princeton Ave
- 94 Marchmont Dr
Ask me questions while you tour the home.