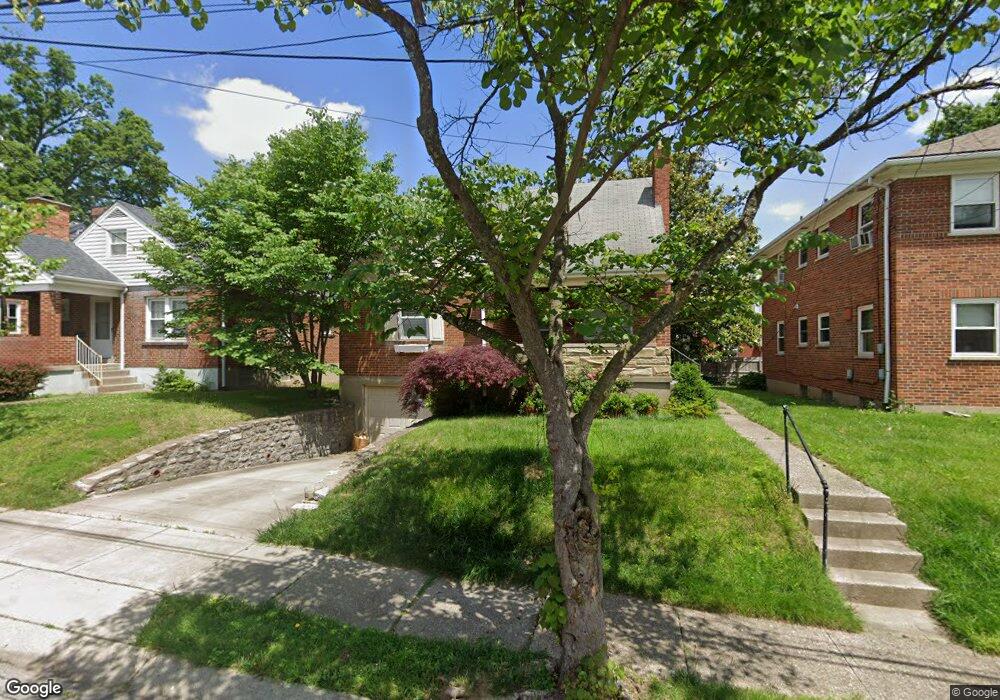
3326 Maplecrest Place Cincinnati, OH 45209
Oakley NeighborhoodEstimated Value: $396,111 - $436,000
3
Beds
3
Baths
1,362
Sq Ft
$303/Sq Ft
Est. Value
About This Home
This home is located at 3326 Maplecrest Place, Cincinnati, OH 45209 and is currently estimated at $412,778, approximately $303 per square foot. 3326 Maplecrest Place is a home located in Hamilton County with nearby schools including Kilgour Elementary School, Clark Montessori High School, and Shroder High School.
Ownership History
Date
Name
Owned For
Owner Type
Purchase Details
Closed on
Mar 26, 2010
Sold by
Grill Gary M
Bought by
Hutzelman David C
Current Estimated Value
Home Financials for this Owner
Home Financials are based on the most recent Mortgage that was taken out on this home.
Original Mortgage
$160,800
Outstanding Balance
$97,112
Interest Rate
3.5%
Mortgage Type
New Conventional
Estimated Equity
$315,666
Purchase Details
Closed on
Mar 26, 2001
Sold by
Wolfe Elizabeth L
Bought by
Grill Gary M
Home Financials for this Owner
Home Financials are based on the most recent Mortgage that was taken out on this home.
Original Mortgage
$140,400
Interest Rate
7.02%
Purchase Details
Closed on
Nov 10, 1997
Sold by
Chase Edna M
Bought by
Wolfe Elizabeth L
Home Financials for this Owner
Home Financials are based on the most recent Mortgage that was taken out on this home.
Original Mortgage
$90,695
Interest Rate
7.46%
Create a Home Valuation Report for This Property
The Home Valuation Report is an in-depth analysis detailing your home's value as well as a comparison with similar homes in the area
Home Values in the Area
Average Home Value in this Area
Purchase History
| Date | Buyer | Sale Price | Title Company |
|---|---|---|---|
| Hutzelman David C | $201,000 | Commitment Land Title Agency | |
| Grill Gary M | $175,500 | -- | |
| Wolfe Elizabeth L | $93,500 | -- |
Source: Public Records
Mortgage History
| Date | Status | Borrower | Loan Amount |
|---|---|---|---|
| Open | Hutzelman David C | $160,800 | |
| Previous Owner | Grill Gary M | $140,400 | |
| Previous Owner | Wolfe Elizabeth L | $90,695 |
Source: Public Records
Tax History
| Year | Tax Paid | Tax Assessment Tax Assessment Total Assessment is a certain percentage of the fair market value that is determined by local assessors to be the total taxable value of land and additions on the property. | Land | Improvement |
|---|---|---|---|---|
| 2025 | $6,667 | $108,290 | $37,079 | $71,211 |
| 2023 | $6,611 | $108,290 | $37,079 | $71,211 |
| 2022 | $7,081 | $104,062 | $34,097 | $69,965 |
| 2021 | $6,816 | $104,062 | $34,097 | $69,965 |
| 2020 | $7,016 | $104,062 | $34,097 | $69,965 |
| 2019 | $6,669 | $90,490 | $29,649 | $60,841 |
| 2018 | $6,679 | $90,490 | $29,649 | $60,841 |
| 2017 | $6,345 | $90,490 | $29,649 | $60,841 |
| 2016 | $5,454 | $76,682 | $24,504 | $52,178 |
| 2015 | $4,917 | $76,682 | $24,504 | $52,178 |
| 2014 | $4,952 | $76,682 | $24,504 | $52,178 |
| 2013 | $4,623 | $70,351 | $22,481 | $47,870 |
Source: Public Records
Map
Nearby Homes
- 3334 De Forest Dr
- 3319 De Forest Dr
- 4422 Canyon Oak Ct
- 4418 Canyon Oak Ct
- 2947 Iron Oak Ln
- 3390 Wasson Rd
- 3917 Paxton Ave
- 3640 Herschel Ave
- 4109 Marburg Ave
- 3259 Berwyn Place
- 4024 Marburg Ave
- 3548 Saybrook Ave
- 4006 Taylor Ave
- 3311 Bach Ave
- 4147 Maple Dr
- 3764 Mount Vernon Ave
- 4121 Ballard Ave
- 3209 Bach Ave
- 3763 Mount Vernon Ave
- 3327 Brotherton Rd
- 3322 Maplecrest Place
- 3318 Maplecrest Place
- 3327 Ameliamont Ave
- 3323 Ameliamont Ave
- 3331 Ameliamont Ave
- 3319 Ameliamont Ave
- 3335 Ameliamont Ave
- 3314 Maplecrest Place
- 3338 Maplecrest Place
- 3327 Maplecrest Place
- 3323 Maplecrest Place
- 3331 Maplecrest Place
- 3315 Ameliamont Ave
- 3335 Maplecrest Place
- 3319 Maplecrest Place
- 3339 Ameliamont Ave
- 3310 Maplecrest Place
- 3315 Maplecrest Place
- 3339 Maplecrest Place
- 3311 Ameliamont Ave
Your Personal Tour Guide
Ask me questions while you tour the home.