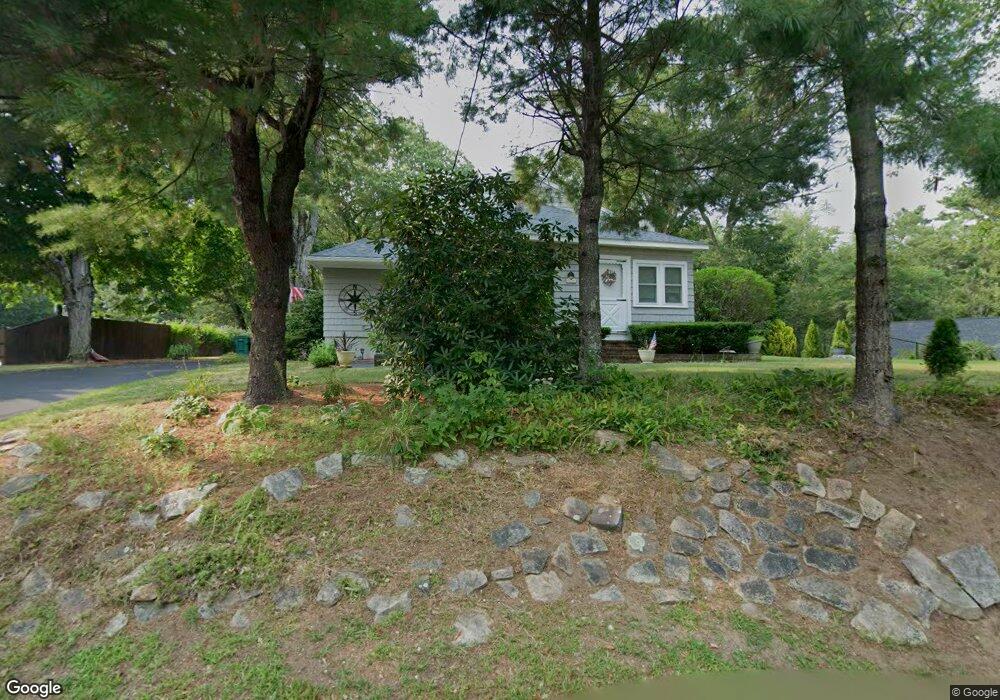
333 Balcom St Mansfield, MA 02048
Estimated Value: $594,575 - $703,000
3
Beds
2
Baths
1,602
Sq Ft
$406/Sq Ft
Est. Value
About This Home
This home is located at 333 Balcom St, Mansfield, MA 02048 and is currently estimated at $650,394, approximately $405 per square foot. 333 Balcom St is a home located in Bristol County with nearby schools including Everett W. Robinson Elementary School, Jordan/Jackson Elementary School, and Harold L. Qualters Middle School.
Ownership History
Date
Name
Owned For
Owner Type
Purchase Details
Closed on
Oct 30, 2000
Sold by
Canuel Mark P and Canuel Donna M
Bought by
Guidetti Marina T
Current Estimated Value
Home Financials for this Owner
Home Financials are based on the most recent Mortgage that was taken out on this home.
Original Mortgage
$130,000
Outstanding Balance
$47,731
Interest Rate
7.83%
Mortgage Type
Purchase Money Mortgage
Estimated Equity
$602,663
Create a Home Valuation Report for This Property
The Home Valuation Report is an in-depth analysis detailing your home's value as well as a comparison with similar homes in the area
Home Values in the Area
Average Home Value in this Area
Purchase History
| Date | Buyer | Sale Price | Title Company |
|---|---|---|---|
| Guidetti Marina T | $189,900 | -- |
Source: Public Records
Mortgage History
| Date | Status | Borrower | Loan Amount |
|---|---|---|---|
| Open | Guidetti Marina T | $130,000 | |
| Previous Owner | Guidetti Marina T | $50,000 |
Source: Public Records
Tax History
| Year | Tax Paid | Tax Assessment Tax Assessment Total Assessment is a certain percentage of the fair market value that is determined by local assessors to be the total taxable value of land and additions on the property. | Land | Improvement |
|---|---|---|---|---|
| 2025 | $6,356 | $482,600 | $241,900 | $240,700 |
| 2024 | $6,421 | $475,600 | $241,900 | $233,700 |
| 2023 | $6,252 | $443,700 | $241,900 | $201,800 |
| 2022 | $6,179 | $407,300 | $223,900 | $183,400 |
| 2021 | $5,726 | $372,800 | $196,000 | $176,800 |
| 2020 | $5,233 | $340,700 | $186,700 | $154,000 |
| 2019 | $5,010 | $329,200 | $155,500 | $173,700 |
| 2018 | $3,275 | $314,400 | $148,300 | $166,100 |
| 2017 | $4,614 | $307,200 | $144,100 | $163,100 |
| 2016 | $4,227 | $274,300 | $137,200 | $137,100 |
| 2015 | $4,077 | $263,000 | $137,200 | $125,800 |
Source: Public Records
Map
Nearby Homes
Your Personal Tour Guide
Ask me questions while you tour the home.