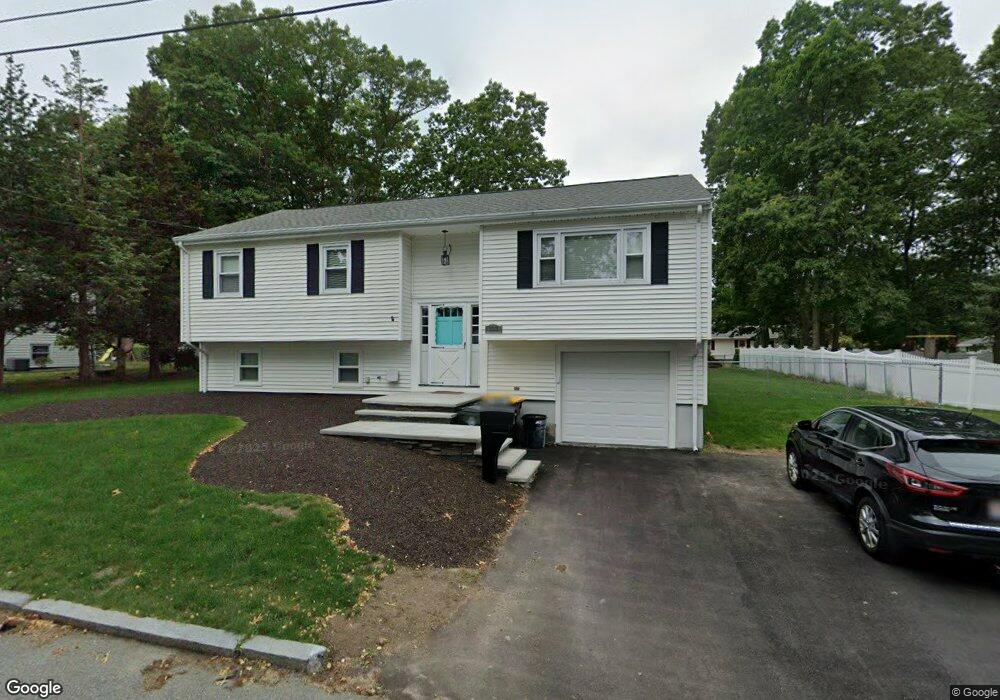
333 Dunbar St Fall River, MA 02723
Bank Street NeighborhoodEstimated Value: $474,793 - $510,000
3
Beds
1
Bath
1,864
Sq Ft
$263/Sq Ft
Est. Value
About This Home
This home is located at 333 Dunbar St, Fall River, MA 02723 and is currently estimated at $489,948, approximately $262 per square foot. 333 Dunbar St is a home located in Bristol County with nearby schools including Mary Fonseca Elementary School, Talbot Innovation School, and B M C Durfee High School.
Ownership History
Date
Name
Owned For
Owner Type
Purchase Details
Closed on
Sep 18, 2020
Sold by
Bezubka John and Vonhelmstatten Nancy L
Bought by
Rodrigues Sarah and Rodrigues Oscar
Current Estimated Value
Home Financials for this Owner
Home Financials are based on the most recent Mortgage that was taken out on this home.
Original Mortgage
$231,200
Outstanding Balance
$204,794
Interest Rate
2.8%
Mortgage Type
New Conventional
Estimated Equity
$285,154
Create a Home Valuation Report for This Property
The Home Valuation Report is an in-depth analysis detailing your home's value as well as a comparison with similar homes in the area
Home Values in the Area
Average Home Value in this Area
Purchase History
We collect this data history from publicly available records. To have your information removed, we recommend requesting removal directly through your county’s website.
| Date | Buyer | Sale Price | Title Company |
|---|---|---|---|
| Rodrigues Sarah | $289,000 | None Available |
Source: Public Records
Mortgage History
We collect this data history from publicly available records. To have your information removed, we recommend requesting removal directly through your county’s website.
| Date | Status | Borrower | Loan Amount |
|---|---|---|---|
| Open | Rodrigues Sarah | $231,200 |
Source: Public Records
Tax History
| Year | Tax Paid | Tax Assessment Tax Assessment Total Assessment is a certain percentage of the fair market value that is determined by local assessors to be the total taxable value of land and additions on the property. | Land | Improvement |
|---|---|---|---|---|
| 2025 | $4,771 | $416,700 | $141,400 | $275,300 |
| 2024 | $4,272 | $371,800 | $136,000 | $235,800 |
| 2023 | $4,142 | $337,600 | $122,100 | $215,500 |
| 2022 | $3,626 | $287,300 | $113,000 | $174,300 |
| 2021 | $3,348 | $242,100 | $106,700 | $135,400 |
| 2020 | $3,325 | $230,100 | $102,700 | $127,400 |
| 2019 | $3,355 | $230,100 | $102,700 | $127,400 |
| 2018 | $3,189 | $218,100 | $102,700 | $115,400 |
| 2017 | $2,995 | $213,900 | $102,700 | $111,200 |
| 2016 | $2,733 | $200,500 | $102,700 | $97,800 |
| 2015 | $2,574 | $196,800 | $96,100 | $100,700 |
| 2014 | $2,476 | $196,800 | $96,100 | $100,700 |
Source: Public Records
Map
Nearby Homes
- 128 Windsor St
- 585 N Eastern Ave
- 0 Rich St
- 235 Chavenson St
- 1243 New Boston Rd
- 1163 New Boston Rd
- 124 Downing St
- 1124 Bedford St
- 49 Downing St
- 580 County St
- 367 County St
- 229 Concord St
- 349 County St
- 70 Jencks St
- 178 County St
- 6 N Rocliffe St
- 131 Thomas St
- 1268 President Ave
- 153 Jencks St
- 529 Eastern Ave
Your Personal Tour Guide
Ask me questions while you tour the home.